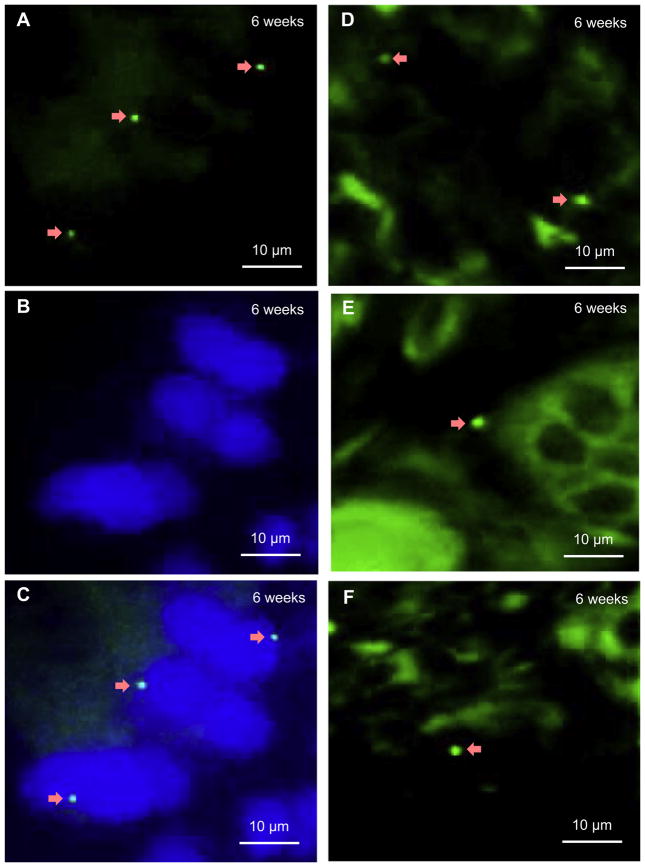
Fig. 7.
FISH images for samples harvested at 6 weeks for the BMSC recipient group. (A) In osteoblasts in woven bone, Y chromosomes (arrows) were probed with FITC (green) in nuclei, which were stained blue with DAPI in (B). Y chromosomes were identified in the middle regions of implants (D, E, F). Since FITC can non-specifically bind with cytoplasm, the cytoplasm also showed green. All images were from FISH. (A) was stained with FITC. (B) was stained with DAPI. (C) was merged by (A) and (B). (D, E, F) were stained with FITC. During the FISH operation for (D, E and F), a higher concentration of probes than that in (A) was labeled with FITC, hence (D, E and F) showed more green than (A). Arrows indicate Y chromosomes. (For interpretation of the references to colour in this figure legend, the reader is referred to the web version of this article.)

