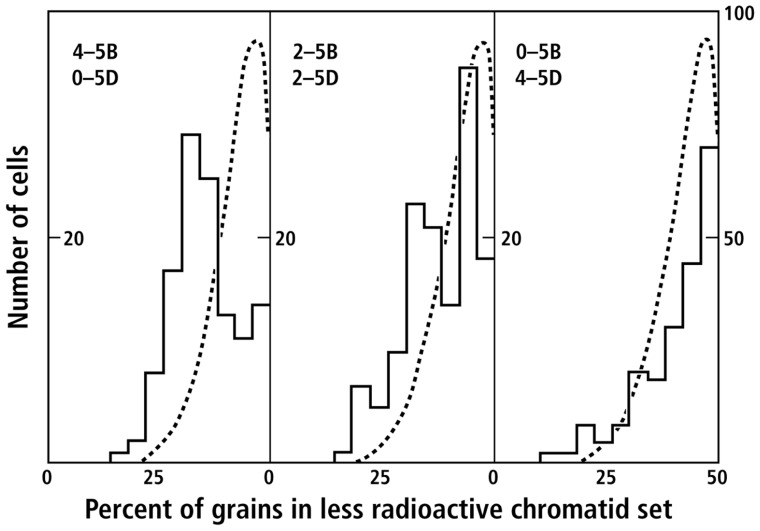
FIGURE 4.
Sister chromatid segregation in mitotic figures of T. aestivum: effects of varying the dosage of chromosomes 5B and 5D (data from Lark, 1969a, Figure 7). Histograms of the frequency of cells in which the indicated percentages of grains were observed in the less radioactive chromatid set during anaphase or telophase. Deviation to the left of 50% indicates the degree of asymmetry. The dashed curve represents the expected binomial distribution for random segregation (for details, see Lark, 1969a).

