
Figure 6. c-Myc- and Ha-Ras-specific oncogene signatures in prostate tumors are conserved in other tissues.
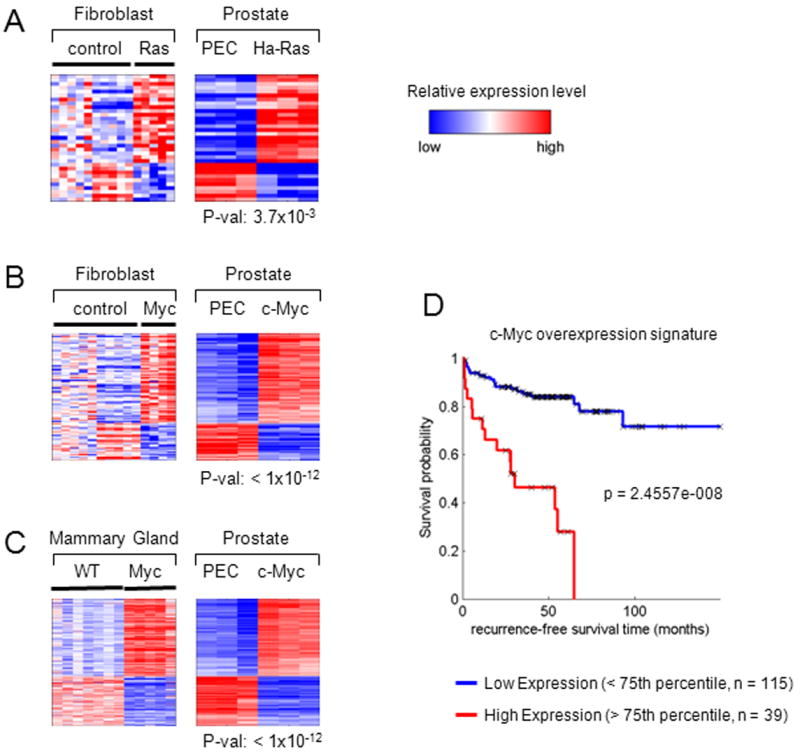
Heatmaps show genes that are differentially expressed in the oncogene-induced prostate cancer cell lines and in (A) Ha-Ras and (B) c-Myc fibroblasts (3T3 cell line). (C) A heatmap shows the intersection of genes that are differentially expressed in the c-Myc prostate cancer cell line and mouse mammary tumor samples. The p values shown under each prostate cell line heatmap represent the significance of the overlap between the prostate and fibroblast/mammary tumor signatures. (D) Kaplan Meier curves are shown for high (upper 25th percentile) and low (lower 75th percentile) expression populations for the c-Myc overexpression signature used to interrogate the clinical data of (2).