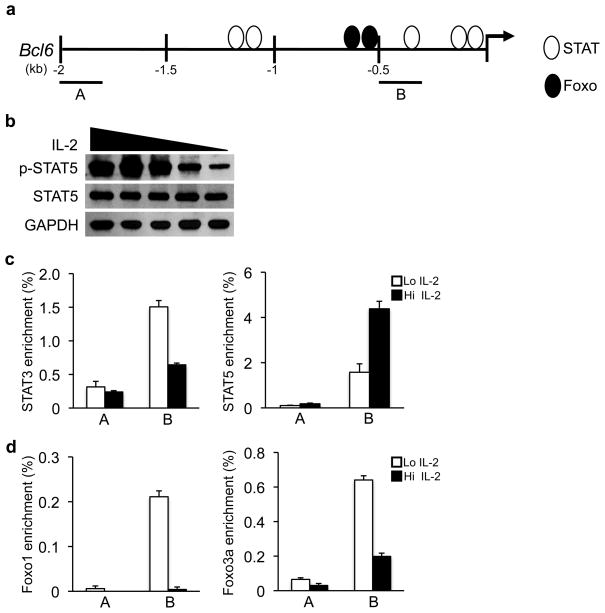
Figure 3. STAT and Foxo transcription factors regulate Bcl6.
(a) Schematic representing STAT and Foxo DNA-binding element locations in the Bcl6 promoter. Regions monitored in ChIP analysis (A or B) are shown. (b) Immunoblot analysis of p-STAT5 and total STAT5 protein in wild-type TH1 cells exposed to variable IL-2 concentrations. (c, d) ChIP experiments were performed with wild-type TH1 polarized cells maintained in either high (Hi; black bars) or low (Lo; white bars) IL-2 conditions. Chromatin samples were immunoprecipitated with either an antibody to (c) STAT3, STAT5 or (d) Foxo1, Foxo3a, or (c, d) an IgG antibody control and quantitated by qPCR to monitor the identified binding elements (B) or a negative control region (A) in the Bcl6 promoter. To calculate the percent input, the values for the precipitated samples were first normalized to a standardized aliquot of the input chromatin for each condition, followed by subtraction of the IgG antibody control as the nonspecific background of the experiment. Data in (b) are representative of three independent experiments. Data in (c, d) represent the mean of three independent experiments (error bars, s.e.m.).

