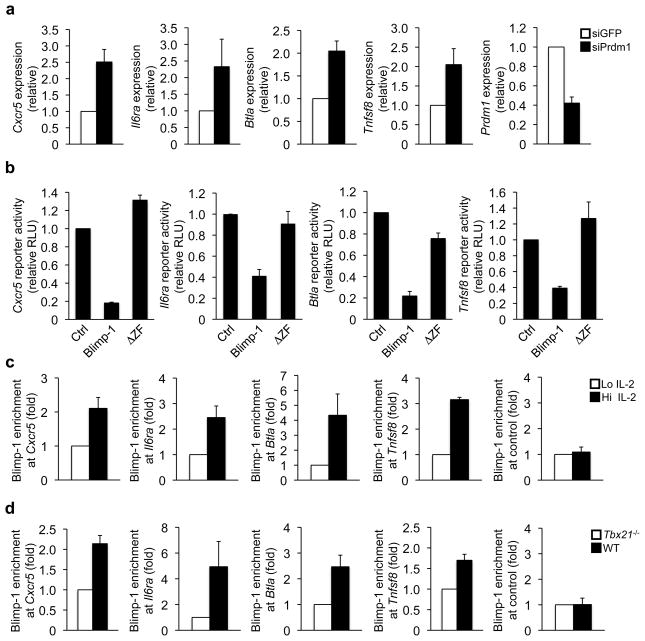
Figure 6. Blimp-1 directly represses TFH-genes in effector TH1 cells.
(a) Wild-type TH1 cells were transfected with either a control (siGFP; white bars) or Prdm1 (siPrdm1; black bars) siRNA. The genes indicated on the y-axis were analyzed as in Fig. 1g and are represented relative to the siGFP sample. (b) EL4 T cells were transfected with either a Cxcr5, Il6ra, Btla, or Tnfsf8 promoter reporter and either an empty expression vector control, wild-type Blimp-1, or Blimp-1ΔZF. Normalized luciferase values are expressed relative to the vector control. (c) ChIP experiments were performed with wild-type TH1 polarized cells maintained in either high (Hi; black bars) or low (Lo; white bars) IL-2 conditions. Chromatin samples were immunoprecipitated with either an antibody to Blimp-1 or an IgG control. Blimp-1-precipitated samples were normalized as in Fig. 3c to obtain the percent input value (Supplementary Fig. 6b). The data are graphically represented as fold enrichment, which is the ratio of the percent input for each sample relative to the low IL-2 sample from the same experiment (Hi; black bars or Lo; white bars). (d) Chromatin was isolated from either wild-type (black bars) or Tbx21−/− (white bars) CD4+ T cells polarized in TH1 conditions. The ChIP experiments were performed and normalized as in (c) with the exception that the fold enrichment is relative to the Tbx21−/− percent input values (Supplementary Fig. 6c). Data in (a–d) represent the mean of three independent experiments (error bars, s.e.m.).

