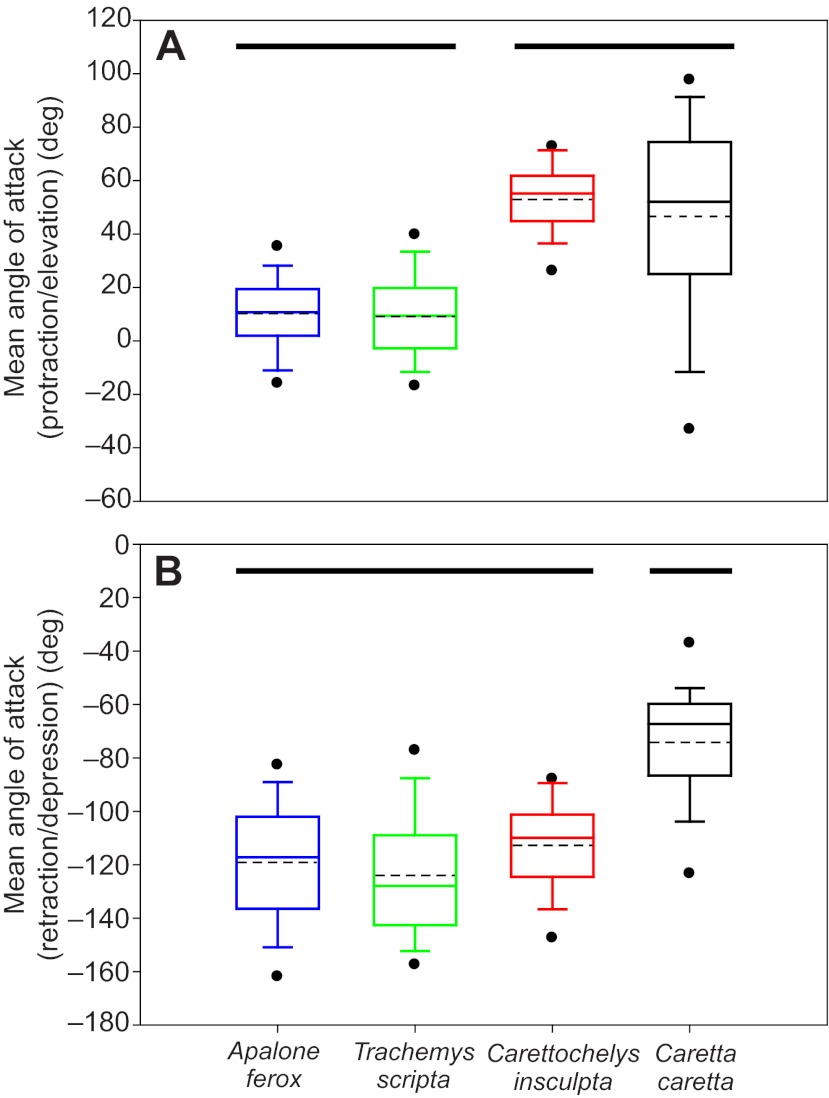
Fig. 7.
Comparison of hydrodynamic angle of attack of the forelimb at mid-phase for protraction/elevation (A) and retraction/depression (B) in four species of turtle. For each trial, a representative midstroke protraction/elevation value was calculated as the mean of the five central values during this phase, and a representative midstroke retraction/depression value was calculated as the mean of the five central values during this phase. Box plots are based on the distributions of these representative values: solid lines indicate medians, dashed lines indicate means, box margins represent 50th and 75th percentiles, whiskers show 10th and 90th percentiles, and circles show 5th and 95th percentiles. Angle of attack was calculated as the angle between a vector representing the path of motion of the tip of the forelimb (digit 3) and a vector emerging from the palmar surface of a plane defined by the tips of digits 1 and 5 and the elbow. Small angular values indicate a shallow angle between the path of limb motion and the forefoot; an angle of 0 deg during protraction/elevation indicates the leading edge of the forefoot is oriented perfectly along the path of motion in a low-drag orientation. Maximum drag orientation of the forefoot paddle relative to the path of motion of the forefoot is indicated by an angle of 90 deg during protraction/elevation, and an angle of –90 deg during retraction/depression. Results of post hoc multiple comparison Tukey’s tests are indicated with solid black lines above the boxplots. During protraction/elevation, two groups were identified; rowing Apalone ferox and Trachemys scripta do not differ from one another, and Carettochelys insculpta groups with flapping Caretta caretta. However, during retraction/depression, C. insculpta groups with rowing species.

