Fig. 1.
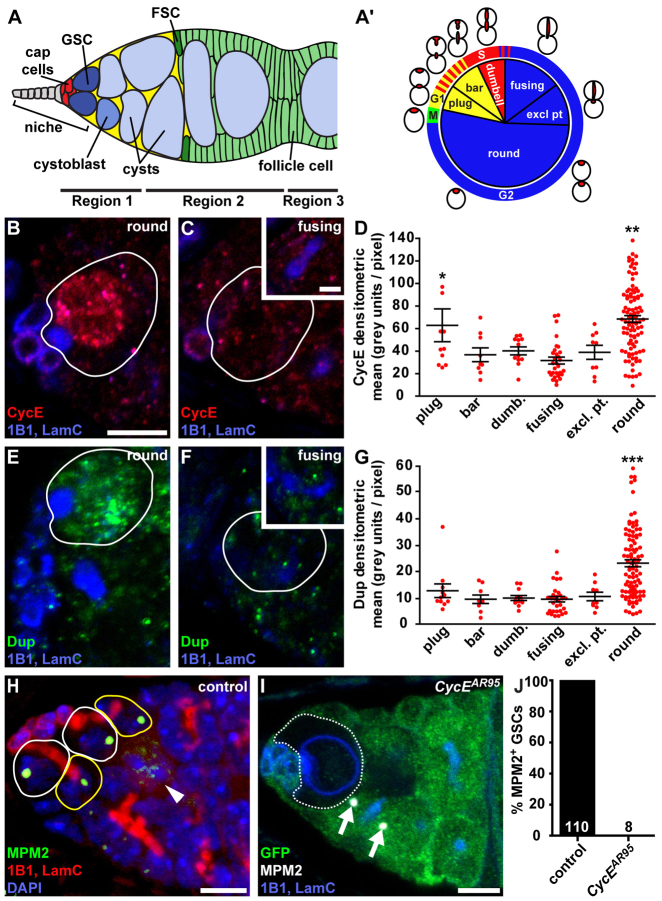
CycE expression peaks during G2, leading to an atypical CycE activity pattern in GSCs. (A) Drosophila germarium. GSCs in a niche composed of terminal filament (grey), cap cells and a subset of escort cells (yellow) give rise to cystoblasts that form 16-cell cysts. (A′) Distribution of GSCs displaying specific fusome morphologies relative to cell cycle phases (supplementary material Fig. S1, Table S1). (B-G) Expression of CycE (B-D) and Dup (E-G) in GSCs. (B,C,E,F) CycE (red; B,C) or Dup (green; E,F) expression in GSCs (outlined) with ‘round’ (B,E) or ‘fusing’ (C,F) fusomes; insets show GSC fusomes, visible in adjacent optical slices. (D,G) Average CycE (D) or Dup (G) fluorescence intensity in GSCs according to fusome morphology. Bars represent s.e.m. *P<0.05, compared with ‘fusing’; **P<0.05, compared with ‘bar’, ‘dumbbell’, ‘fusing’ and ‘exclamation point’; ***P<0.05, compared with all other fusome morphologies. (H) Maximum intensity projection (6 μm thickness) showing MPM2 (green) labeling the histone locus body in GSCs (white outlines) and nascent cystoblasts (yellow outlines). In mitotically dividing cysts (e.g. eight-cell cystocyte indicated by an arrowhead), MPM2 expression oscillates, as described previously (Narbonne-Reveau and Lilly, 2009). (I) MPM2 (white) labeling the histone locus body (arrows) in wild-type germline cells (marked by GFP; green), but absent from a GFP-negative CycE-null GSC (circled). (B,C,E,F,I) 1B1, fusomes (blue); LamC, cap cell nuclear envelopes (blue). LamC is also prominent in CycE mutant germ cells. Scale bars: 5 μm in all main panels or 2.5 μm in insets in C,F. (J) Quantification of MPM2-positive wild-type versus CycE-deficient GSCs. Numbers in bars represent the number of GSCs analyzed.

