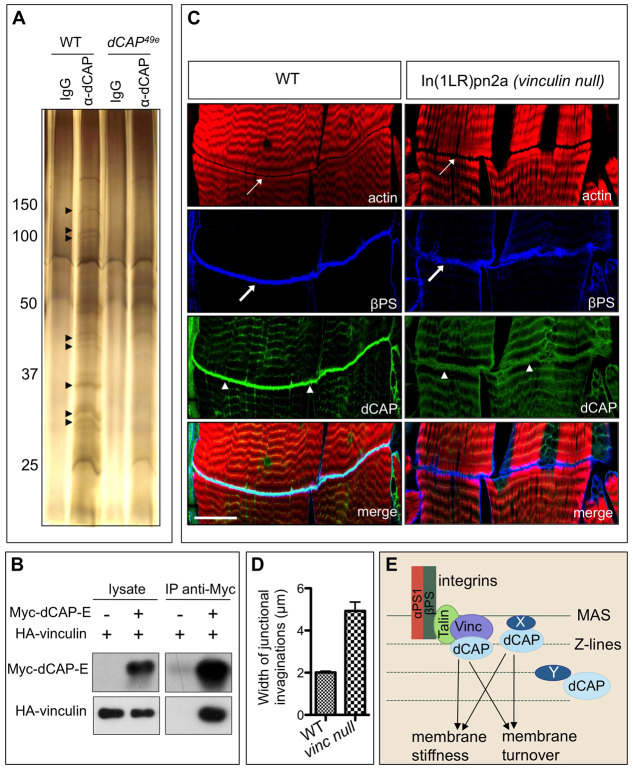
Fig. 9.
CAP interacts with Vinculin, and Vinculin depletion partially phenocopies CAP mutants. (A) Silver-stained PAGE showing anti-CAP immunoprecipitates from wild-type and CAP embryonic lysates. Arrowheads indicate bands specific to wild-type lysates. (B) Myc-tagged CAP-E immunoprecipitates HA-tagged Vinculin when co-expressed in S2R+ cells. (C) vinculin mutants show a reduction in CAP levels at the MASs (arrowheads). MASs in vinculin mutant larvae show aberrant cytoskeletal organization (top panels, thin arrows), and increased βPS integrin-labeled junctional infoldings at MASs (blue, thick arrows). (D) Quantification of MAS defects in larvae. Data are mean±s.e.m. (E) Schematic of CAP function and recruitment of key signaling molecules. Scale bar: 30 μm.

