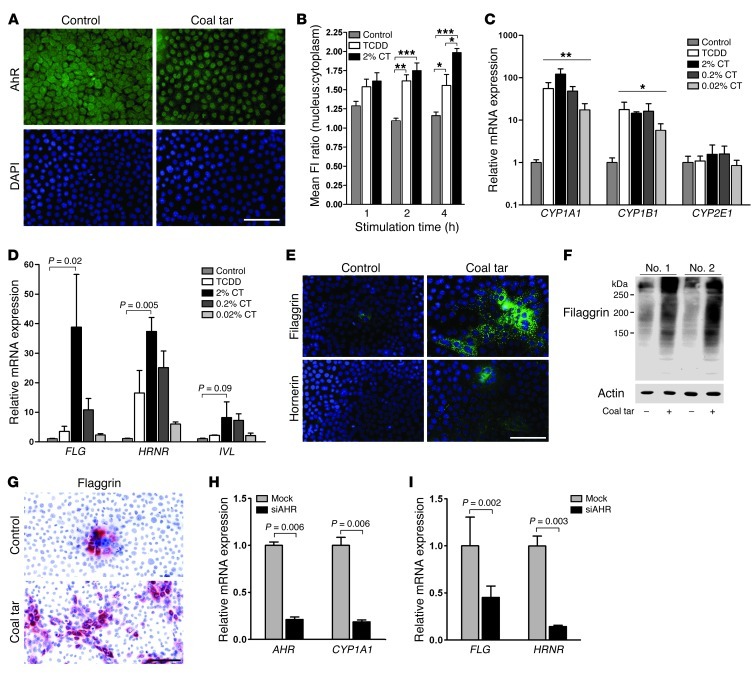
Figure 1. Coal tar induces epidermal differentiation via AHR signaling.
(A) AHR staining of coal tar–treated or untreated keratinocytes. Nuclei were counterstained using DAPI. Scale bar: 100 μM. (B) Semiquantitative analysis of nuclear and cytoplasmic fluorescence intensity (FI) measured by ImageJ software. *P < 0.05, **P < 0.01, and ***P < 0.001, relative to untreated keratinocytes. Bars indicate mean ± SEM (n = 3). (C) CYP450 mRNA expression levels after 48 hours of stimulation with TCDD or a coal tar concentration series. Expression levels are relative to untreated (control) keratinocytes. *P < 0.05 and **P < 0.001. Bars indicate mean ± SEM (n = 3). (D) mRNA expression levels of epidermal differentiation genes after 48 hours of stimulation with TCDD or a coal tar concentration series. Expression levels are relative to untreated (control) keratinocytes. Bars indicate mean ± SEM (n = 3). (E) Filaggrin and hornerin staining of 2% coal tar–treated or untreated keratinocytes. Nuclei were counterstained using DAPI. Scale bar: 100 μM. (F) Western blot analysis of filaggrin protein in lysates of coal tar–treated and untreated keratinocytes from 2 keratinocyte donors. (G) Filaggrin staining of 2% coal tar–treated or untreated keratinocytes. Nuclei were counterstained using hematoxylin. Scale bar: 100 μM. (H) AHR and CYP1A1, and (I) FLG and HRNR mRNA expression levels after siRNA-mediated AHR knockdown and subsequent 2% coal tar stimulation. Expression levels are relative to mock-treated, coal tar–stimulated keratinocytes. Bars indicate mean ± SEM (n = 3).

