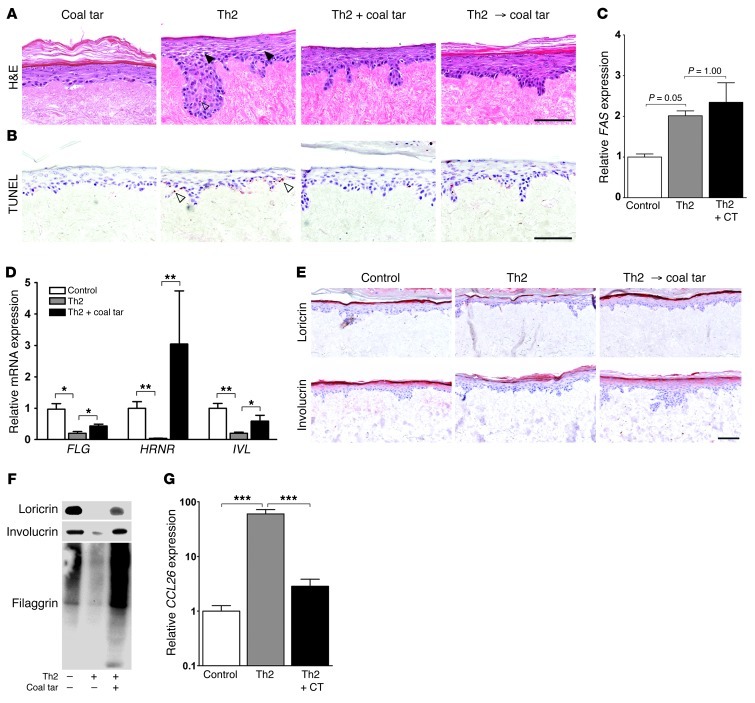
Figure 4. Coal tar attenuates Th2 cytokine–induced AD hallmarks.
(A) H&E staining of skin equivalents stimulated with Th2 cytokines for 3 days, or treated with coal tar thereafter (Th2 → coal tar), or simultaneously stimulated with Th2 cytokines and coal tar (Th2 + coal tar). Closed arrowheads indicate spongiosis. Images are representative of 3 keratinocyte donors. The experiment was replicated twice. Scale bar: 100 μM. (B) TUNEL assay on matching skin equivalents as depicted in A, showing apoptotic cells indicated by open arrowheads. Scale bar: 100 μM. (C) FAS mRNA expression levels in skin equivalents after Th2 cytokine stimulation and coal tar treatment. Expression levels are relative to untreated (control) keratinocytes. Bars indicate mean ± SEM (n = 3). (D) mRNA expression levels of epidermal differentiation genes after Th2 cytokine stimulation and coal tar treatment. Expression levels are relative to untreated (control) keratinocytes. Bars indicate mean ± SEM (n = 3). *P < 0.05 and **P < 0.01. (E) Immunohistochemical staining of loricrin and involucrin in skin equivalents stimulated with Th2 cytokines for 3 days, or treated with coal tar thereafter (Th2 → coal tar). Images are representative of 3 keratinocyte donors. The experiment was replicated twice. Scale bar: 100 μM. (F) Loricrin, involucrin, and filaggrin Western blotting of skin equivalents are depicted in E. (G) CCL26 mRNA expression levels after Th2 cytokine stimulation and coal tar treatment by qPCR analysis. Expression levels are relative to untreated (control) keratinocytes. Bars indicate mean ± SEM (n = 3). ***P < 0.001.

