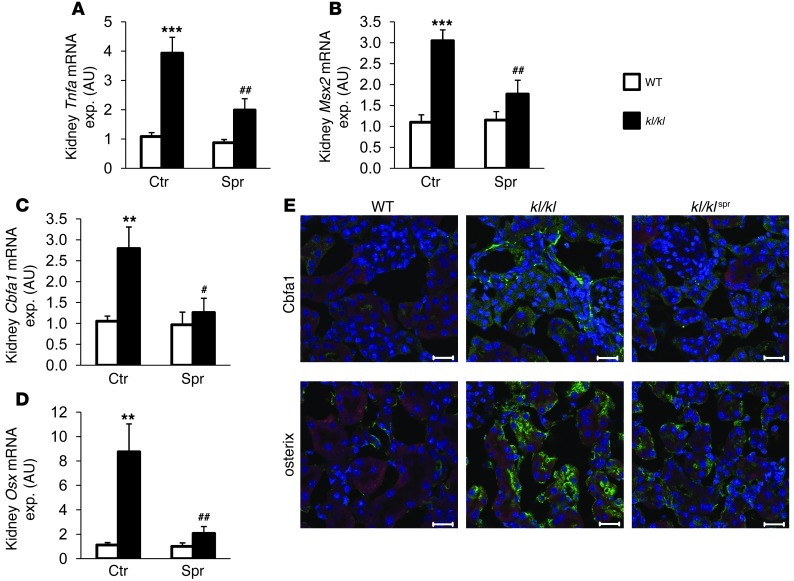
Figure 5. Influence of spironolactone treatment on renal osteoinductive signaling in kl/kl mice.
Arithmetic mean ± SEM (n = 7–8; arbitrary units) of mRNA levels encoding (A) Tnfa, (B) Msx2, (C) Cbfa1, and (D) Osx in renal tissue of WT mice (white bars) and kl/kl mice (black bars), treated with control solution or spironolactone. #P < 0.05, ##P < 0.01, compared with kl/kl mice; **P < 0.01, ***P < 0.001, compared with WT control-treated mice. (E) Immunohistochemical analysis and confocal microscopy (original magnification, ×400) of Cbfa1 and osterix expression in renal tissue of WT mice, kl/kl mice, and kl/kl mice treated with spironolactone. Osteoblastic marker expression is represented by green labeling, nuclei are labeled in blue, and actin staining is labeled in red. Scale bar: 20 μm.

