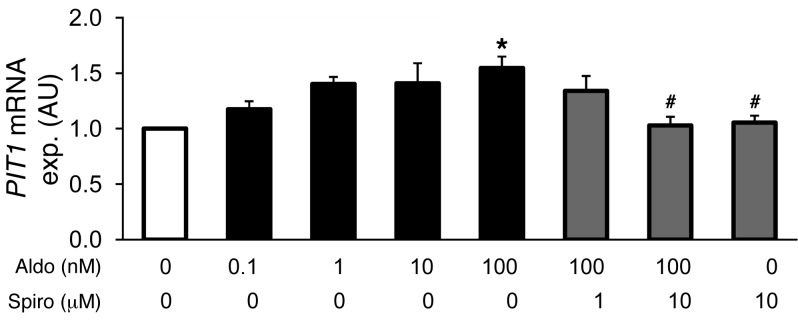
Figure 6. Aldosterone sensitivity of PIT1 gene expression in HAoSMCs.
Arithmetic mean ± SEM (n = 6; arbitrary units) of PIT1 mRNA levels in HAoSMCs after 24-hour treatments with vehicle alone (white bar), with aldosterone (Aldo, 1–100 nM, black bars), or with spironolactone (Spiro, 0–10 μM, gray bars). #P < 0.05, compared with HAoSMCs treated with 100 nM aldosterone alone; *P < 0.05, compared with HAoSMCs treated with vehicle alone.

