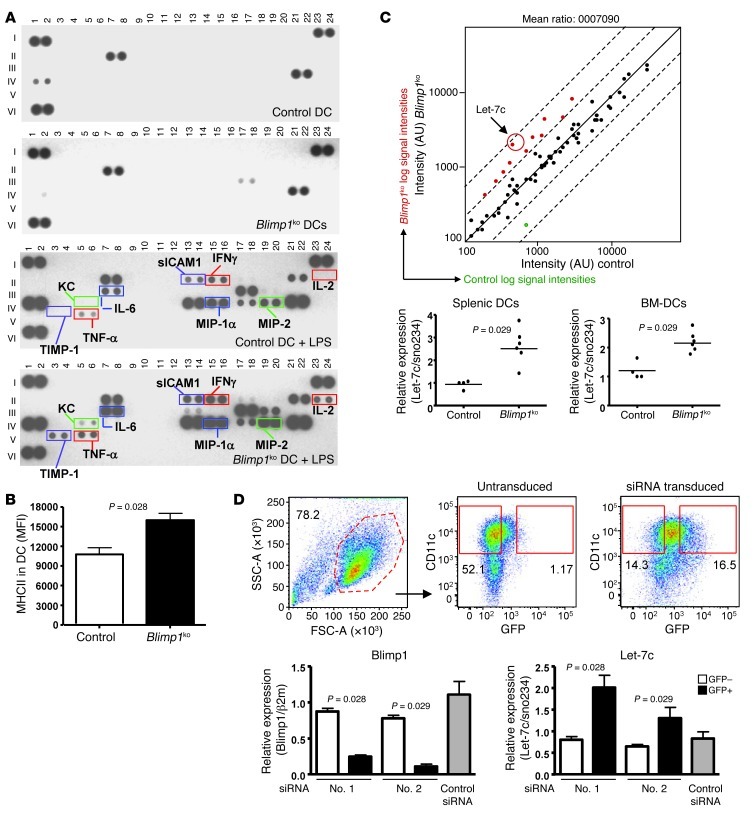
Figure 1. Proinflammatory phenotype and increased let-7c in Blimp1-deficient DCs.
(A) Cytokines and chemokines were measured by protein array in supernatant from an overnight culture of splenic DCs purified from control or DCBlimp1ko mice in the presence or absence of LPS (1 μg/ml). Legend of individual proteins is provided in Supplemental Table 1. A pool of 2 mice was used for one blot. Representative pictures of 3 independent experiments. (B) Surface expression of MHC II was measured by flow cytometry and MFI was plotted. (Mean ± SEM of 4 independent experiments) (n = 8). (C) miRNA array was performed with RNAs from sorted splenic DCs from control and DCBlimp1ko mice. A representative plot from 2 independent arrays. Pool of 6 mice were used per group and per array. Expression of let-7c was measured by qPCR and relative expression level was calculated (right panel). Relative expression was calculated based on sno234 small RNA. Each dot represents an individual mouse, and the bar represents the mean. (D) BM-DCs were infected with lentivirus encoding either anti-Blimp1 or control siRNA with a GFP reporter gene. siRNA-transduced BM-DCs were sorted by expression of GFP, and total RNA was prepared. Expression of Blimp1 and let-7c was measured by qPCR, and relative expression was normalized to indicated housekeeping genes. Flow cytometry images for sorting are representative images from 3 independent experiments (upper panel). Graph depicts the mean ± SEM of 3 independent experiments (n = 6).

