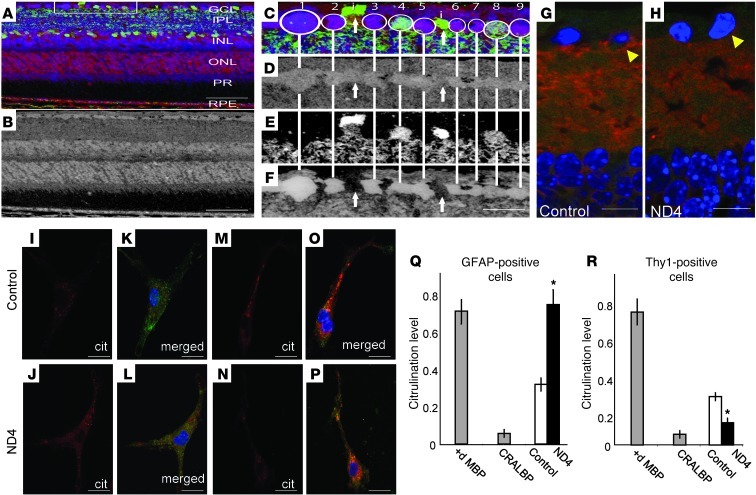
Figure 2. Decreased deimination in demyelinating diseases occurs in the neurons.
(A) Validation of deimination in RGCs using small-molecule phenotyping (42) in mouse retina. Multispectral visualization of citrulline (red channel), GABA (green channel), and glutamate (blue channel). RPE, retinal pigmented epithelium. (B) Citrulline immunoreactivity in gray scale channel. Scale bars: 50 μm (A, B). (C) Enlargement of the boxed region (90 μm) in A. Circled cells 1–9 are RGCs with strong deimination signals. (D) Varied GABA signals. (E) Cells 4 and 8 have strong glutamate signals. (F) Cells labeled “i” (as noted in panel C) are displaced amacrine cells and have weaker citrullination (∼2-fold less). Scale bar: 15 μm (F). (G and H) Detection of presynaptic (Syntaxin-1, red) and postsynaptic (PSD 95, green) markers in control (G) and ND4 (H) retinas (arrowhead indicates region around RGCs). Scale bars: 20 μm (G and H). (I–L) Detection of deimination (using anti-citrulline [Cit]) in isolated astrocytes from control (I and K) and ND4 (J and L) mice. Panels K and L are the merged figure of GFAP (green) and deimination. (M–P) Detection of deimination (red) in isolated RGCs from control (M and O) and ND4 (N and P) mice. Panels O and P are the merged figure of Thy1 (green) and deimination. Scale bars: 20 μm (I–P). (Q and R) ELISA analyses of deimination for GFAP- (Q) and Thy1-positive cells (R) from control and ND4 mice. 10 μg of deiminated MBP (positive) and CRALBP (negative) used as controls. *P < 0.05

