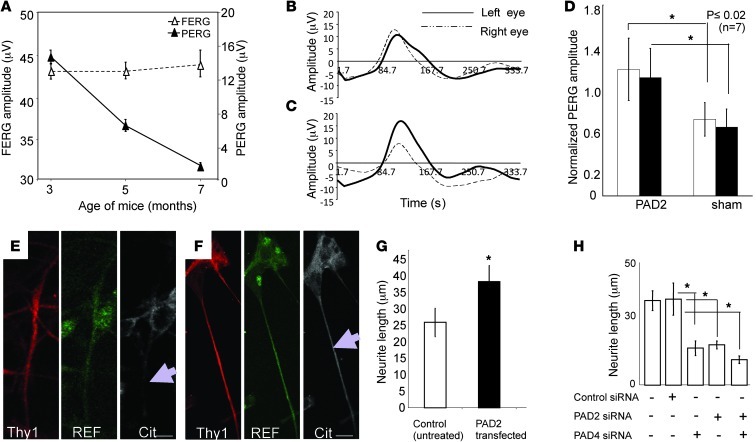
Figure 3. Restoration of deimination and visual function.
(A) Evaluation of FERG and PERG amplitudes in ND4 mice. Representative mean ± SD at indicated ages (n = 10 mice per group). (B–D) evaluation of visual function after PAD2 overexpression in RGCs. Representative PERG signal from an ND4 mouse at 3.5 months before injection (B) and 15 days after injection (C). Left eye: PAD2-expressing; right eye: GFP control. (D) PERG amplitude normalized to baseline for PAD2-expressing and control GFP-expressing (sham) animals for 7 injected mice at 15 days (white bars) and at 30 days (black bars). (E) Isolated RGCs from ND4 mice and (F) RGCs from ND4 mice were transfected with PAD2 lentiviral construct and incubated for identical periods. The cells were probed with anti-Thy1, anti-REF, and anti-citrulline as indicated. Scale bars: 10 μm. Arrow indicates neurite outgrowth. (G) The effects of upregulation of PAD2 on neurite outgrowth in cultured RGCs from ND4 mice, control, and PAD2-transfected neurite length measurements are as indicated. (H) Neurite length in cultured RGCs from CD1 mice upon treatment with control siRNA or siRNA against PAD2 and PAD4. In G and H, mean ± SD from 3 independent measurements (derived from 3 different animals) are shown; neurite length (μm) in each experiment was average from 40 neurons. ANOVA showed a statistically significant difference between the control and treated groups. Scheffe’s post hoc test showed that controls were statistically different from treated groups (*P < 0.005).

