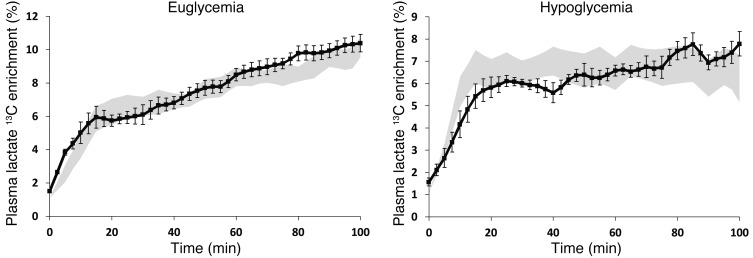
Figure 4. Plasma lactate 13C enrichment during clamps.
Plasma lactate 13C enrichment during (A) euglycemic and (B) hypoglycemic clamps. Patients with T1DM are represented by black symbols; shaded areas represent values in healthy subjects, as reported in ref. 5. All data are expressed as mean ± SEM.

