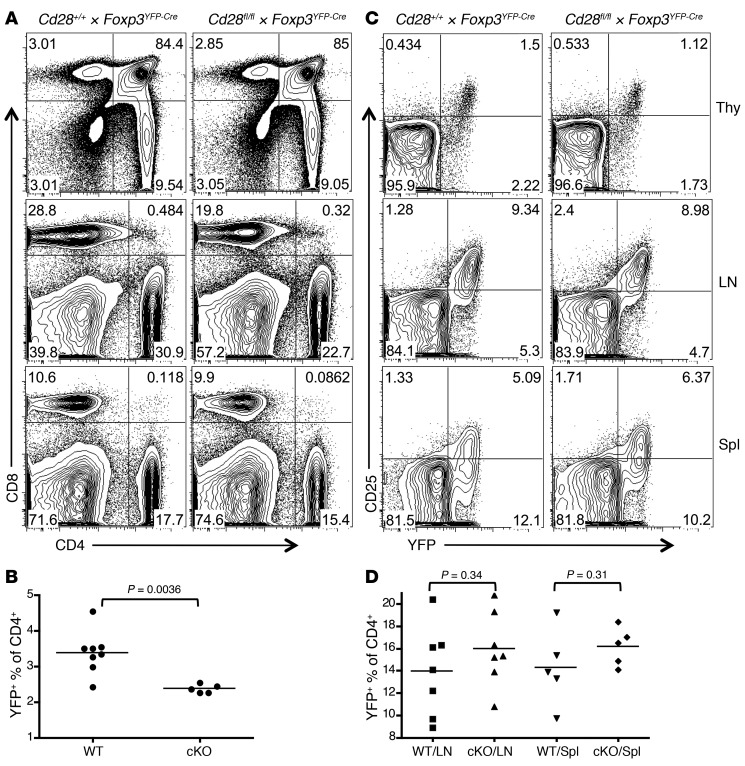
Figure 2. Treg development and homeostasis in Cd28-ΔTreg mice.
(A and B) Representative analysis for (A) CD4 and CD8 and (B) CD25 and YFP in the thymi (Thy), lymph nodes, and spleens (Spl) of littermate control (Cd28+/+ × Foxp3YFP-Cre) and Cd28-ΔTreg mice (Cd28fl/fl × Foxp3YFP-Cre) mice (age 5 weeks). (C and D) Percentage of Tregs (defined as YFP+) in CD4+CD8– T cells from (C) thymi and (D) lymph nodes or spleens of 4- to 7-week-old mice. WT, control Cd28+/+ × Foxp3YFP-Cre mice; cKO, Cd28fl/fl × Foxp3YFP-Cre mice. Symbols represent individual mice; horizontal bars indicate the mean.

