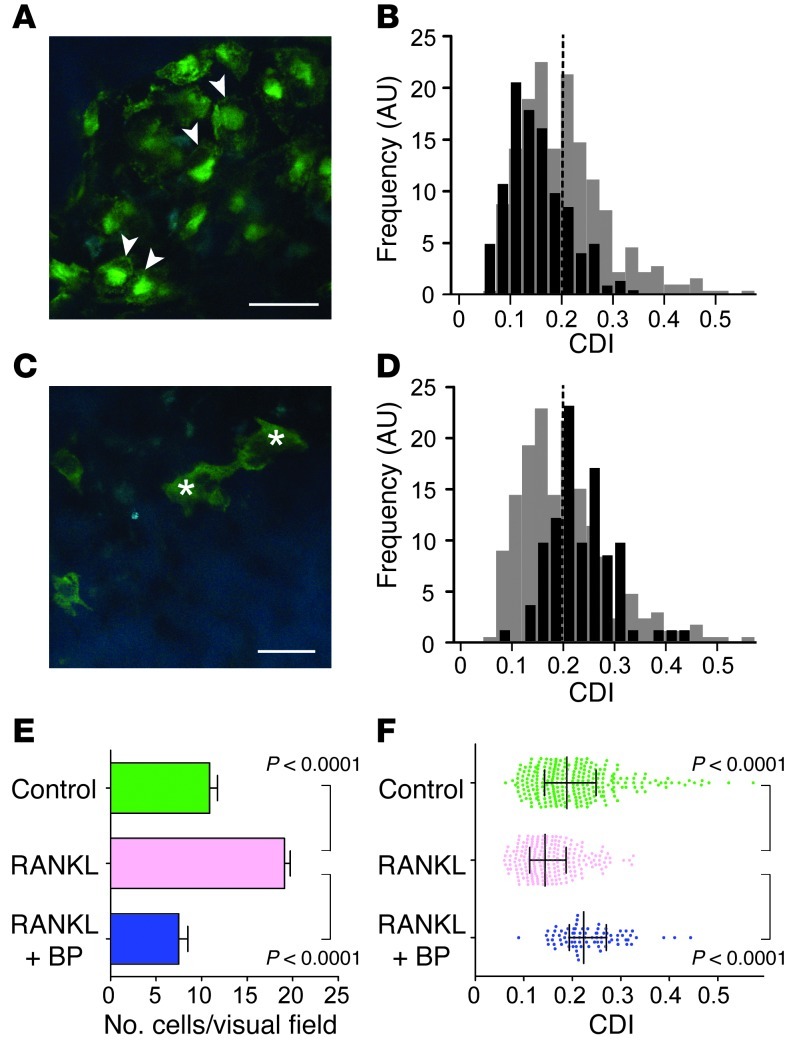
Figure 2. Visualization of mature osteoclasts under pathophysiological conditions.
(A and B) A representative image of live bone imaging of a3-GFP mice after RANKL application (A, Supplemental Video 3). Arrowheads indicate a3-GFP at peripheral cell membrane. Scale bar: 40 μm. Histogram of CDIs for osteoclasts imaged under RANKL treatment conditions (black) and control conditions (gray, same as in Figure 1H) (B) (n = 224, collected from 5 independent experiments). (C and D) Representative depiction of live bone imaging of a3-GFP mice after application of RANKL and risedronate (C, Supplemental Video 4). Asterisks indicate a3-GFP in cytoplasm. Scale bar: 40 μm. Histogram of the CDIs for osteoclasts imaged under RANKL plus risedronate-treatment conditions (black) and under control conditions (gray, same as in Figure 1H) (D) (n = 82, from 5 independent experiments). (E) Total number of mature osteoclasts. from 5 independent experiments. (F) Distribution of CDI. Data points (n = 259 for control, n = 224 for RANKL, and n = 82 for RANKL plus risedronate) represent individual cells compiled from 5 independent experiments. Error bars represent medians ± interquartile range.

