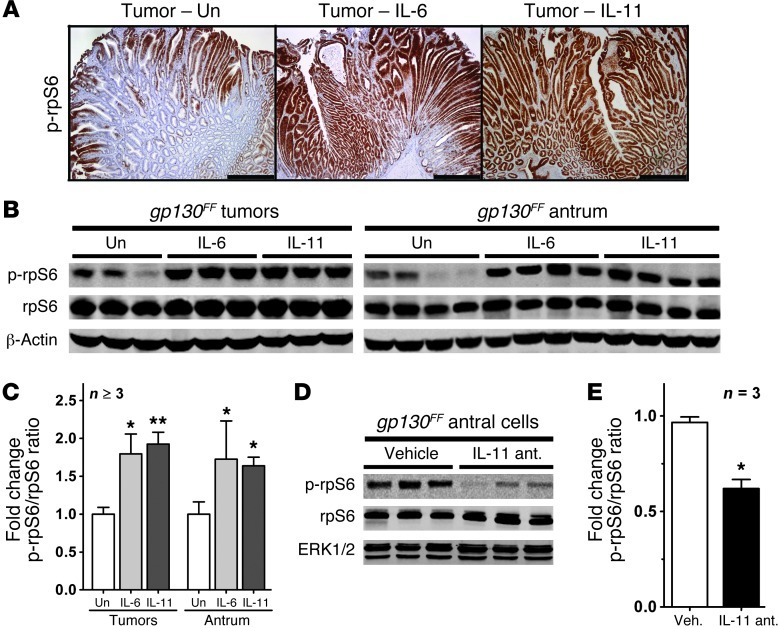
Figure 2. Regulation of mTORC1 activity by GP130 signaling.
(A) Representative immunostaining for p-rpS6 on sections of gastric tumors from 10-week-old gp130FF mice collected 60 minutes after a single i.p. injection of 5 μg of IL-6 or IL-11. Scale bar: 500 μm. (B and D) Immunoblot analysis (B) for p-rpS6 of pooled tumors and unaffected antra from individual mice collected 60 minutes after a single i.p. injection of 5 μg of IL-6 or IL-11 or (D) of gastric epithelial cells extracted from the antra of individual mice that have been treated for 4 weeks with an IL-11 antagonist (ant.). Also refer to Supplemental Figure 2. (C and E) Quantification of the immunoblots shown in (C) B and (E) D, expressed as mean fold change ± SEM when compared with the p-rpS6/rpS6 ratio of vehicle-treated (Veh.) mice (*P < 0.05, **P < 0.01). Un, unstimulated.

