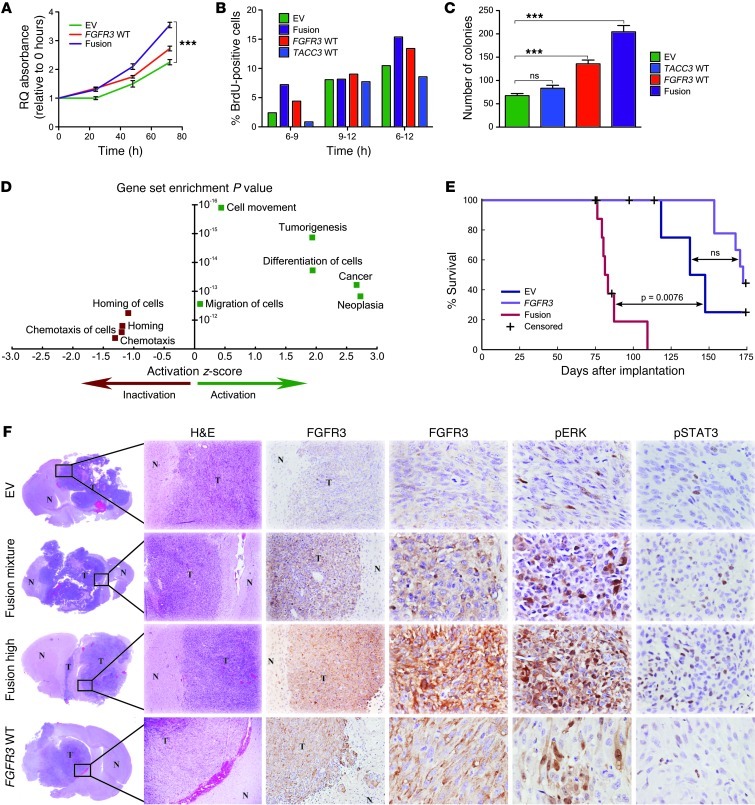
Figure 4. FGFR3-TACC3 promotes tumor progression in vivo.
(A) MTT assay measuring the viability of FGFR3-TACC3 fusion, WT FGFR3, and EV stable cell lines 48 and 72 hours after cell plating. ***P < 0.001, 2-way ANOVA. (B) BrdU incorporation assay of FGFR3-TACC3 fusion, WT FGFR3, WT TACC3, and EV cell lines 0, 6, 10, and 12 hours after incorporation. (C) Quantification of colony number in FGFR3-TACC3 fusion, WT FGFR3, WT TACC3, and EV cell lines. ***P < 0.001, 2-tailed Student’s t test. (D) Top 10 altered pathways identified by IPA for differential gene expression between SNB19 cell lines transfected with FGFR3-TACC3 fusion and those transfected with EV. Positive regulation z scores indicate increased pathway activation. Only the top 9 pathways are shown because IPA analysis did not allocate a regulation z score for the next gene sets. Statistical analyses were performed using Fisher exact test for gene set enrichment. (E) Kaplan-Meier survival plot showing that higher FGFR3-TACC3 fusion expression led to reduced survival. P values were calculated using the log-rank test. (F) H&E and immunohistochemical staining for the 3 groups of mice, showing increased pSTAT3 and pERK activity in mice injected with FGFR3-TACC3 fusion– or WT FGFR3–expressing cells. In lower-power images, both xenograft tumor tissue (T) and normal mouse brain tissue (N) are indicated. Original magnification, ×40 (H&E); ×100 (FGFR3, left); ×400 (FGFR3, right, pERK, and pSTAT3).

