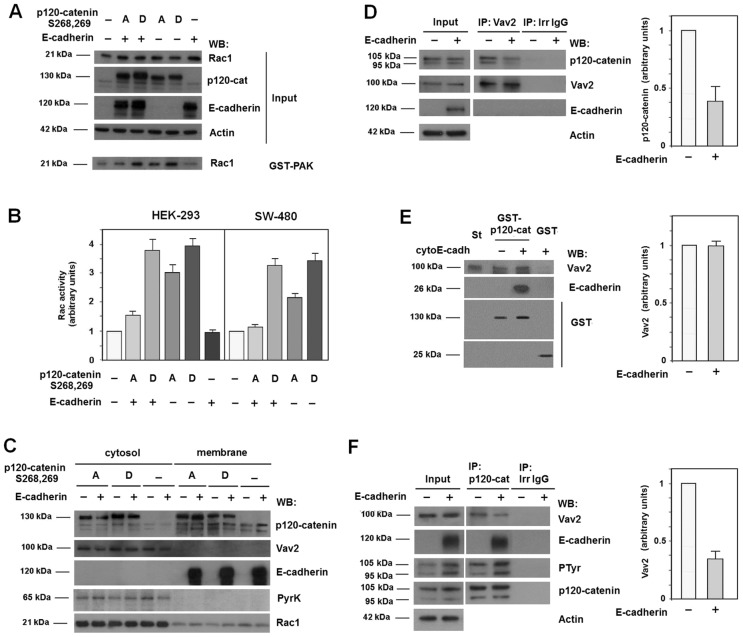
Fig. 6.
Only cytosolic p120-catenin interacts with Vav2 and activates Rac1. (A) HEK-293 cells were transfected with GFP–p120-catenin (p120-cat) isoform 1 point mutants S268,269A, S268,269D and E-cadherin or the empty vector phrGFP. GST–PAK pull-down assays were performed and active Rac1 was detected by western blot (WB). (B) Autoradiograms from five different experiments performed in triplicate as in A in SW-480 and HEK-293 cells were quantified and the mean ± s.d. was determined for each condition. Each value is presented relative to that obtained in nontransfected cells. (C) Cytosolic and membrane lysates were prepared from HEK-293 cells coexpressing GFP–p120-catenin 1 harboring point mutants S268,269A or S268,269D and E-cadherin or the empty vector. The subcellular distributions of p120-catenin mutants, Vav2, E-cadherin and Rac1 were analyzed by WB. Pyruvate kinase was used as a marker for the cytosolic fraction. (D) Vav2 was immunoprecipitated from 500 µg HEK-293 whole-cell extracts transfected with either E-cadherin or the empty vector. Protein complexes were analyzed by WB with anti-p120-catenin and anti-Vav2. 5 µg of HEK-293 whole-cell extracts was included as input. (E) GST–p120-catenin isoform 1 or GST (1.5 pmol) were incubated with recombinant Vav2 (3 pmol) in the presence of a tenfold molecular excess of cyto-E-cadherin (15 pmol) when indicated. Protein complexes were affinity purified and analyzed by WB with the indicated mAbs. Vav2 (0.3 pmol) was included as an internal reference standard (St). (F) p120-catenin was immunoprecipitated from 500 µg HEK-293 whole-cell extracts transfected with either E-cadherin or the empty vector. Protein complexes were analyzed by WB with anti-Vav2, anti-E-cadherin, anti-phospho-tyrosine and anti-p120-catenin. 5 µg of HEK-293 whole-cell extracts was included as input. The autoradiograms in D–F correspond to the four different experiments performed; the autoradiograms were quantified and the mean ± s.d. was obtained for each condition. The result obtained after E-cadherin expression was represented relative to the control.

