
Fig. 4.
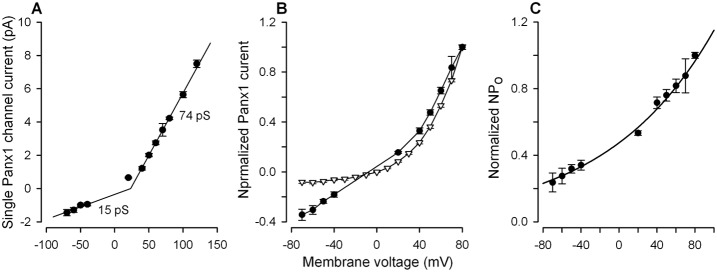
Voltage dependence of the Panx1 current. (A) Single Panx1 channel current versus membrane voltage. The data are presented as a mean ± S.E. (n = 6–11). The solid curve represents a combination of two liner dependencies with the slopes of 15 pS and 74 pS at negative and positive voltages, respectively. (B) Dependencies of single Panx1 channel current (•) and integral Panx1 current (▿) on membrane voltage. The data are presented as a mean ± S.E. and are normalized on the value of the particular current at 80 mV. (C) Voltage dependence of the factor NPo = I/I, calculated using the data in (B). The solid curve corresponds to Eqn 1.