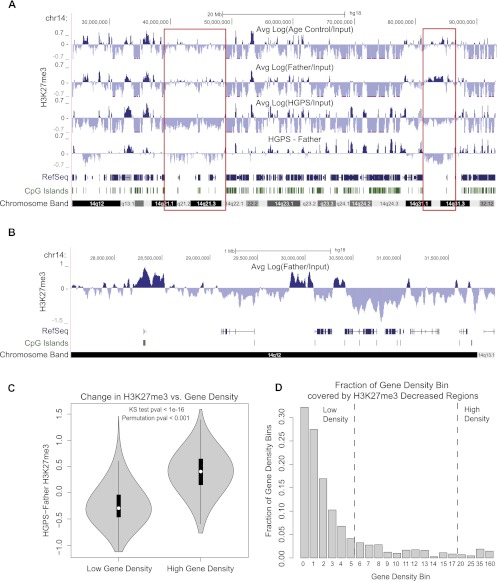
Figure 1.
The correlation between gene density and changes of H3K27me3 signals in HGPS. Three primary fibroblast cell lines used in all experiments were HGADFN167 (HGPS), HGFDFN168 (Father, normal), and AG08470 (Age Control, normal). (A) H3K27me3 signals for Age Control, Father, HGPS, and the difference between Father and HGPS (HGPS-Father) are shown at 25-kb resolution across a region of chromosome 14. Patches of H3K27me3 enrichment are observed in gene-poor regions in control samples (red boxes), and these regions show decreased H3K27me3 in HGPS. RefSeq genes are shown below to indicate gene density, and the locations of CpG islands are noted. (B) A 4-Mb region of chr14 shows enrichment of H3K27me3 in the normal Father fibroblasts at CpG island promoter regions. (C) Distributions of H3K27me3 changes between Father and HGPS [Log(Father/HGPS)] are plotted as a “violin plot” for regions of high gene density (≥20 genes per Mb) and low gene density (≤5 genes per Mb). In all violin plots, the white dot represents the median of the plotted data, the black box indicates the 25% and 75% quartiles, and the gray shape represents the distribution of the plotted signal. Genome wide, H3K27me3 tends to increase in gene-dense regions and decrease in gene-poor regions. This result is significant by a KS test and a circular permutation test of the data (1000 permutations). (D) The genome is divided into bins of differing gene density, with the lower bound of gene density (genes/Mb) indicated below each bar. The fraction of each bin that is covered by 25-kb regions that have at least a 1.5-fold decrease in H3K27me3 in HGPS vs. Father is plotted on the y-axis. The fraction of H3K27me3 depleted regions decreases monotonically as the gene density increases.

