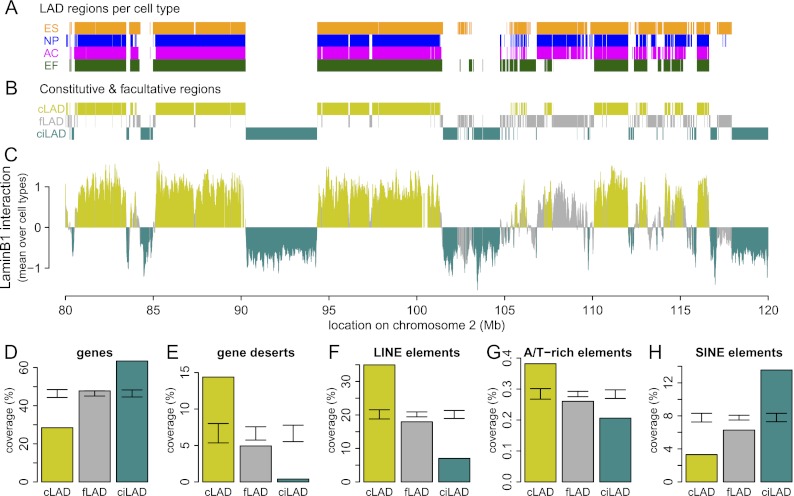
Figure 1.
A core architecture of genome–nuclear lamina interactions. (A) Regions classified by HMM as lamin B1 interacting in mouse ESC (orange), NPC (blue), astrocyte (magenta), and MEF (dark green) cell cultures, shown for a 40-Mb region of chromosome 2. (B) Regions common to all cell types are termed cLADs (mustard) and ciLADs (cyan), with dynamic regions termed fLADs (gray). (C) Mean profile of lamin B1 association in the cell types indicated in A. Colors as in B. The core architecture of constitutive regions makes up ∼71% of the genome, with 33% in cLAD and 38% in ciLAD regions. (D–H) Percent coverage of cLAD (mustard), fLAD (gray), and ciLAD regions for genes (D), gene deserts (E), LINE elements (F), simple A/T-rich elements (G), and SINE elements (H). Error bars indicate two standard deviations around mean coverage values for random regions obtained through circular permutations.

