
Figure 5.
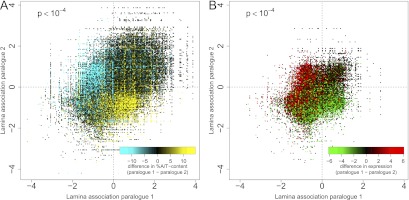
Correlation of A/T content with behavior of paralogous gene pairs. Panels show mean NL interaction scores in mouse ES cells for all known paralog pairs. Each dot represents a paralog pair, colored by percent difference in A/T content (A) and log2 difference in expression level (B). The assignment of paralog 1 or 2 is redundant, hence the symmetry across the diagonal. Expression data for mouse ES cells are taken from Mikkelsen et al. (2007), based on Affymetrix arrays, which is why for a number of genes no value is reported in B.