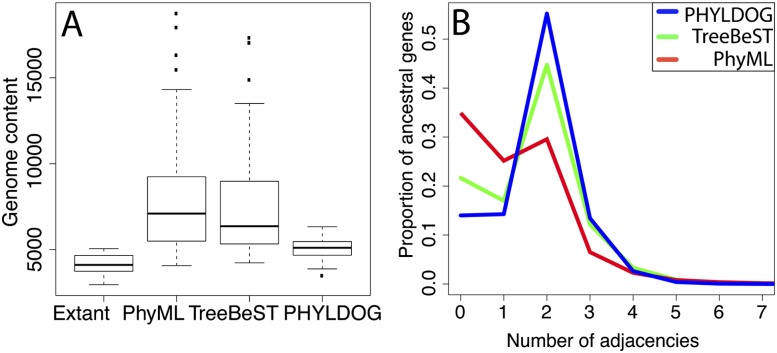
Figure 4.
Quality of ancestral chromosome reconstruction inferred from gene tree reconciliations. We used the species tree and reconciliations from Compara to analyze TreeBeST trees, and the most parsimonious reconciliation using the species tree in Figure 3 for PhyML and PHYLDOG trees. (A) Genome content corresponds to the total number of genes from 5039 families (selected for comparison purposes, see Supplemental Material section S10), for all ancestral nodes in the species phylogeny. “Extant” corresponds to the observed numbers of genes in our data set for extant species. Gene contents reconstructed from PHYLDOG trees are significantly smaller than those reconstructed from TreeBeST trees: paired Wilcoxon test P-value = 4.10−4. (B) Number of adjacencies per ancestral gene. The proportion of genes with two adjacencies is higher for PHYLDOG (blue) than for PhyML (red) and TreeBeST (green) (paired Wilcoxon test P-value = 3.10−11 for the comparison with TreeBeST).

