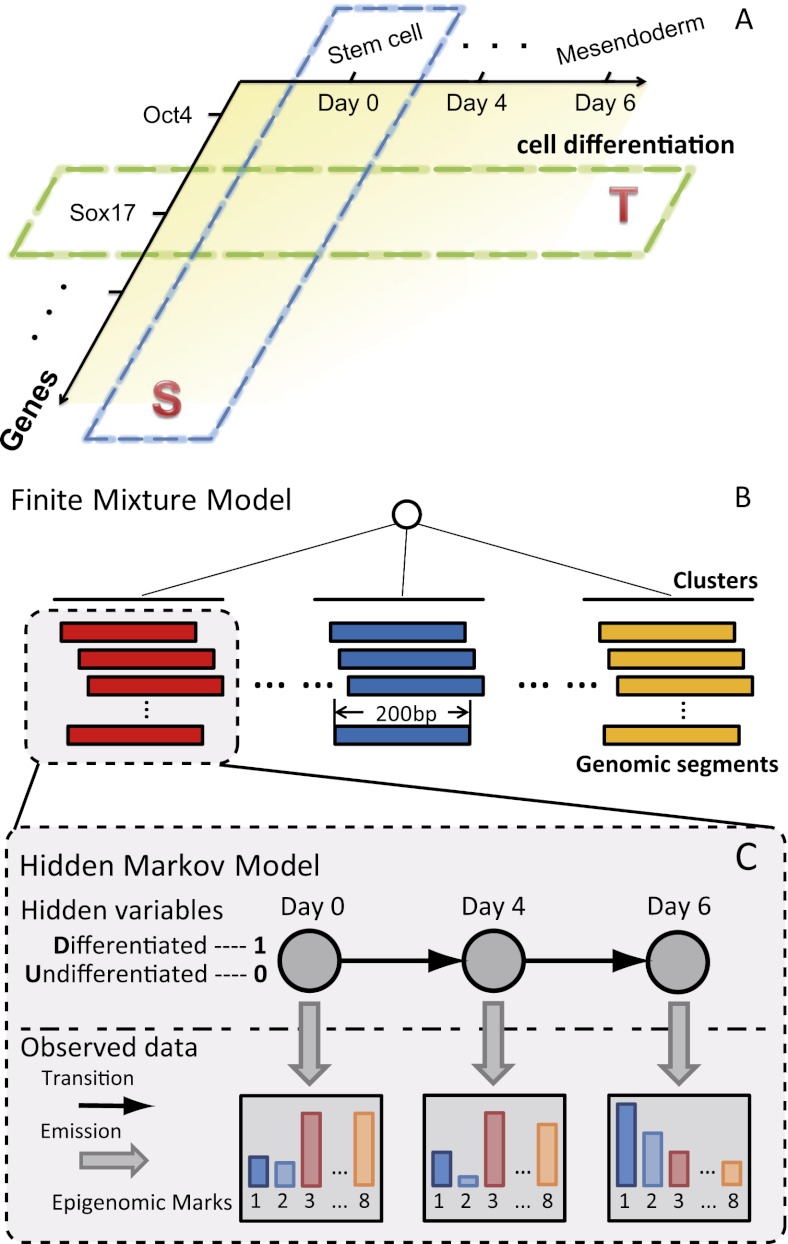
Figure 1.
The genomic annotation based on the time-course epigenomic data (GATE) model. (A) Two types of correlations between the epigenome and gene expression. Spatial correlation (S) examines different genes in a fixed cell type, and temporal correlation (T) examines different differentiation stages or cell types for a fixed gene. Spatial correlation is often much more pronounced than temporal correlation. (B–C) GATE models the genome as equal-sized genomic segments, and each segment is associated with temporal epigenomic data. The model assumes that there are shared temporal epigenomic patterns among different genomic segments. GATE is a hierarchical model. The top layer is a finite mixture model for clustering genomic segments. The bottom layer models the temporal changes within each cluster as a hidden Markov model. The hidden variables (circles) are binary variables, indicating the time of a change of regulatory activities. Emitted (vertical arrows) from the hidden variable are the intensities of each epigenomic mark.

