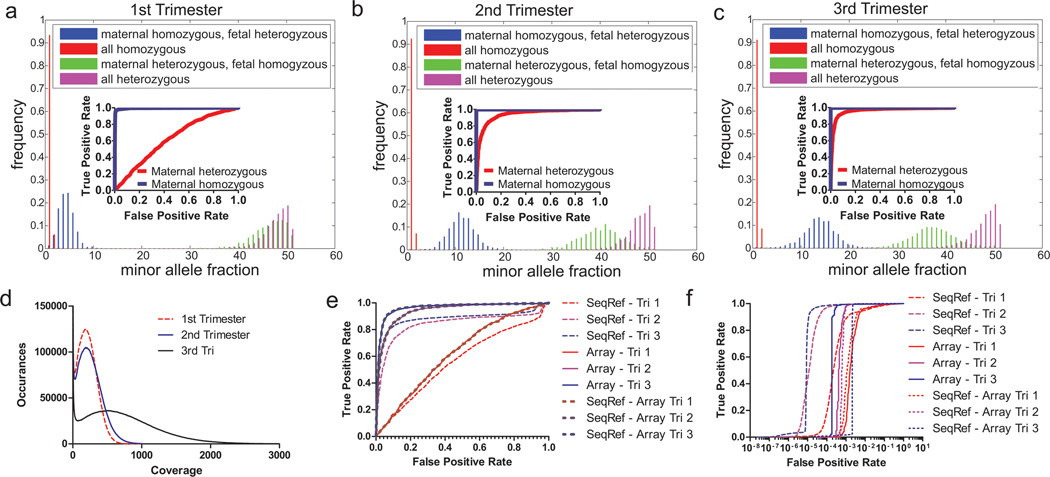
Figure 4.
Exome sequencing of P1 maternal plasma DNA in all three trimesters to determine maternal and fetal genotypes.. A-C. Histograms of minor allele fraction in maternal plasma from all three trimesters of P1 at positions that are confidently called in both plasma sequencing data and pure fetal/maternal DNA genotyping data. Insets: ROC curves of positions detecting fetal genotypes differing from maternal genotype when the maternal position is either homozygous or heterozygous. The higher the fetal fraction (~6, 20, 26% for Trimester 1–3), the more the distributions are separated, and the easier it is to distinguish between the two distributions of fetal genotype. D. Histogram of per-position coverage, with bin size of 5. Exome positions >100X are 75%, 78%, and 90% respectively for Trimester 1–3 and >200X are 48%, 56%, and 84%. E-F. ROCs curves at genomic positions where mother is heterozygous (E) or homozygous (F), using either sequencing or SNP array of pure DNA as references for maternal and fetal genotypes. ‘SeqRef’ uses a sequenced reference, ‘Array’ uses a SNP array, and ‘SeqRef-Array’ uses a sequenced reference only at positions on a SNP array.

