
Figure 2.
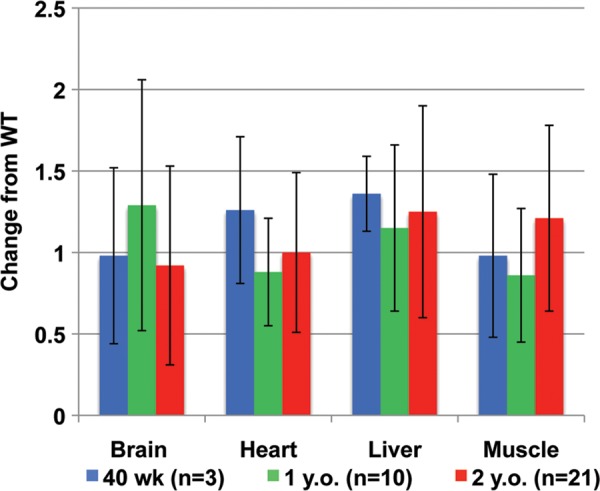
Determination of the mtDNA content in tissues. qPCR analysis was used to determine mtDNA levels in brain, heart, liver and muscle tissues of adult Polg2+/− animals. Data are expressed as fold change from the mean levels of WT tissues. Tissue samples were obtained at 40 weeks (n = 3, blue), 1 year (n = 10, green) and 2 years of age (n = 21, red). No significant changes (P > 0.05) in the mtDNA content were found in any of the tissues at any ages. Error bars indicate ± standard deviation.