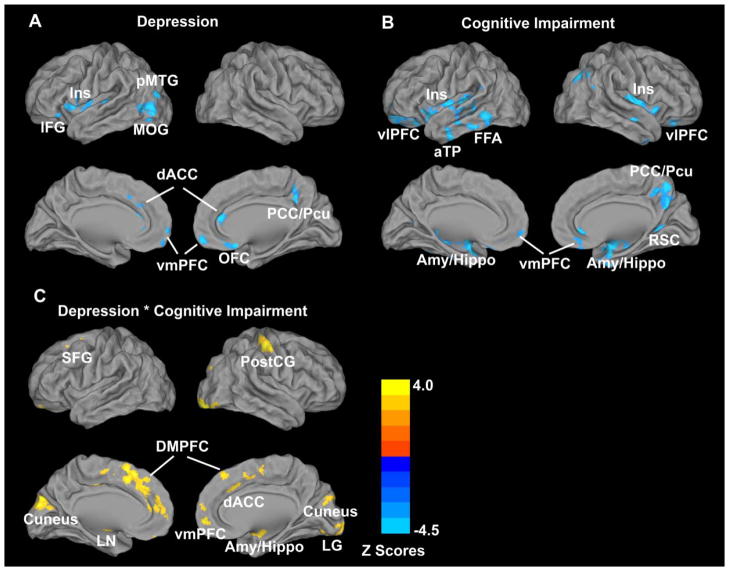
Figure 1. ANCOVA analysis illustrating main and interactive effects of depression and mild cognitive impairment on the gray matter (GM) volumes across all subjects (p < 0.01, FDR corrected).
A: Main effects of depression; B: Main effects of mild cognitive impairment (MCI); C: Interactive effects of depression and MCI. In A and B, blue color illustrates GM atrophy; in C, bright color indicates the interactive effects of depression and MCI on GM volumes.

