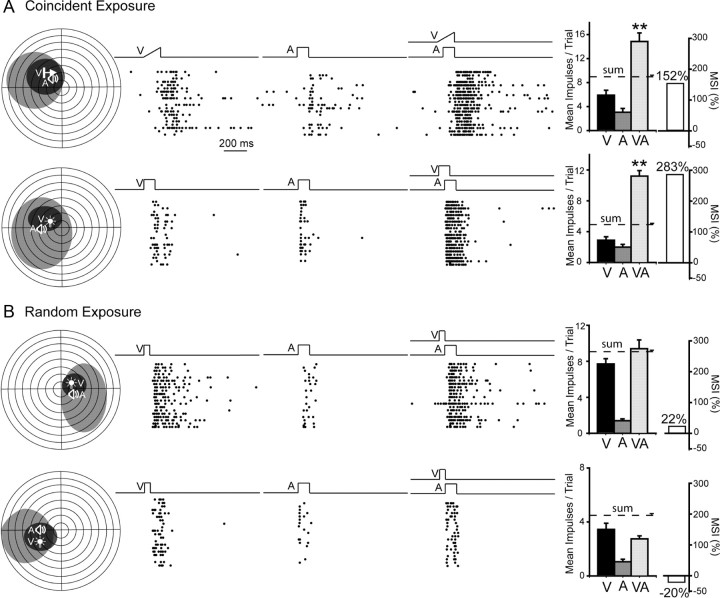
Figure 2.
The development of multisensory integration capabilities was noted after cross-modal exposure, but not after random exposure. A, Coincident exposure produced the normal expression of multisensory integration as revealed by significant multisensory enhancement. Left, Receptive fields are delimited within schematics of visual–auditory space in which each circle represents 10° (black, visual receptive field; gray, auditory receptive field). Icons (V, A) show stimulus locations. Middle, Rasters (ordered bottom-top) illustrate responses to V, A, and V–A stimuli. Right, Summary bar graphs illustrate the mean responses elicited by each stimulus condition, as well as the resultant MSI, a measure of multisensory enhancement. Note that the multisensory response exceeded both unisensory responses and also exceeded their sum, yielding high MSIs (**p < 0.001). B, Random modality-specific exposure failed to produce multisensory integration capabilities in either of the exemplar neurons illustrated. Note the absence of significant multisensory enhancement in both cases, with MSIs between −20% and +22%. Error bars represent the SEM. Receptive fields are contralateral to the SC of the recorded neurons.

