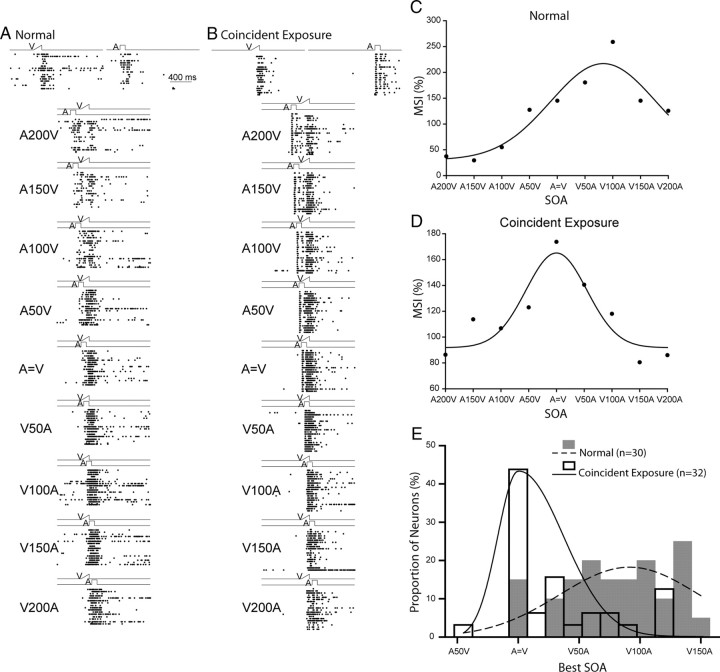
Figure 9.
A temporal “proximity effect” was induced by the cross-modal exposure experience. A–B, Shown are exemplar neurons from animals in the normal control group and from those in the coincident cross-modal exposure group. At the top are shown rasters of their unisensory visual and auditory responses. Just below are rasters showing their responses to stimuli at different SOAs (stimulus onset asynchronies). C–D, The MSI of each neuron in each group is plotted as a function of SOA, fitted with a Gaussian function. A200 V = A preceding V by 200 ms, and V = A represents simultaneity. Note that the optimal SOA for neurons in normal animals is close to 100 ms, whereas for neurons in the coincident cross-modal exposure group the optimal is near simultaneity. E, The distribution of best SOAs (predicted by the peak positions of the Gaussian fit), bin width = 15 ms. Note that in coincident exposure animals the best SOAs are to the left of those from normal animals. Conventions are the same as in prior figures.

