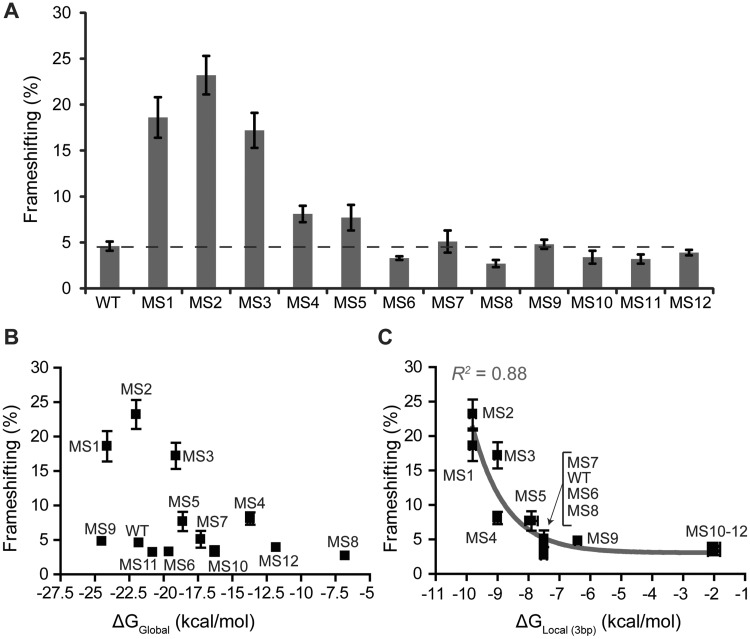
Figure 3.
Frameshift efficiency is plotted as a function of RNA stability. Data represent an average of at least three replicates, with the SEM indicated. (A) In vitro frameshift assay results for WT and MS1-12 RNAs. Error bars representing the SEM are shown. The dashed line is indicative of the WT mean. (B) Overall thermodynamic stability (at 1 M NaCl) versus frameshift efficiency. (C) Local stability (at 1 M NaCl) of first 3 bp versus frameshift efficiency. A single exponential decay function was fit to the data [y = 18(±2)e−0.9(±0.3)(X + 9.8) + 3(±1), R2 = 0.88].

