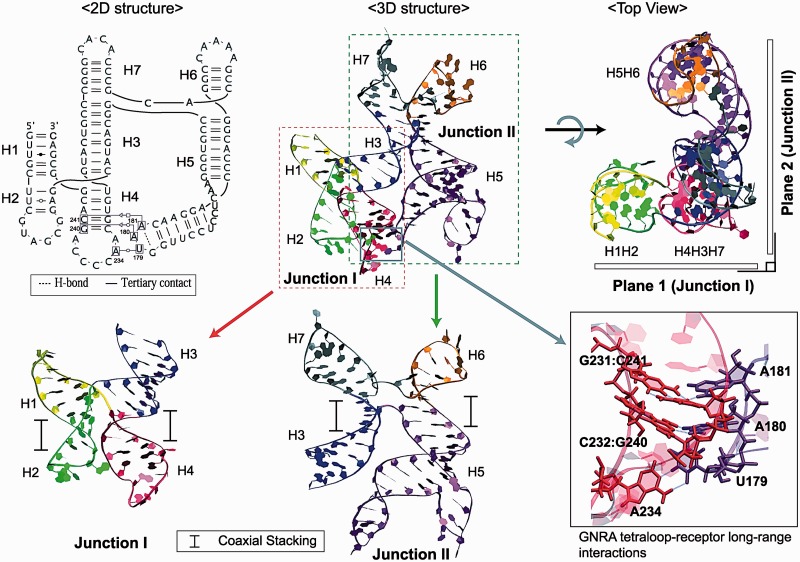
Figure 9.
Time-averaged tertiary structure of domain 3 taken from the 100 ns dynamics data (top middle), where the long-range interactions occur between helices H4 and H5 (details shown at bottom right). Both Junctions I and II contain two coaxial stacking, parallel to each other and Junction I with a crossing in the single-stranded region (bottom-left and -middle for Junctions I and II, respectively). Both junctions are planar locally and are arranged in a perpendicular orientation to each other globally (top right); note that the three helices H4, H3 and H7 are coaxially stacked all together.

