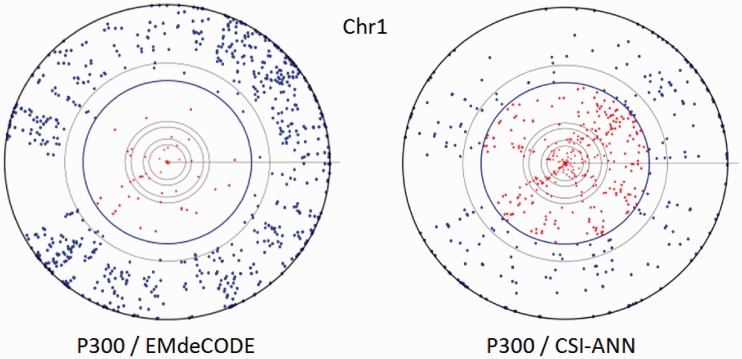
Figure 2.
Chromosome projection mandalas calculated within 2 Kbp for EMdeCODE and CSI-ANN enhancer predictions versus p300 enriched regions on chr1. Each dot on the mandala represents the center of a p300 region in polar coordinates. Angular distance corresponds to genomic location, and radial distance from the outer circle indicates the log-scaled distance in nucleotides from the closest predicted enhancer. Inner circles mark 1, 2 (in blue), 10, 20 Kbp and so on. Blue filled circles represent p300 sites within 2 Kbp from the nearest predicted enhancer.

