
Figure 1.
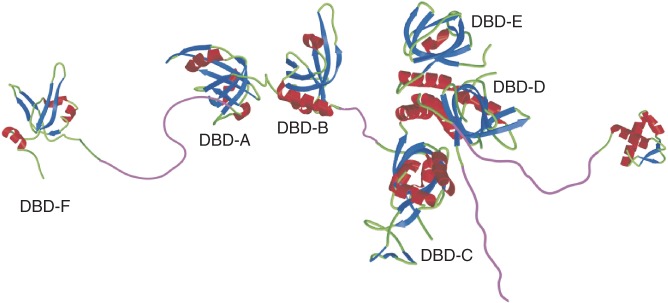
Illustration of the RPA heterotrimer depicting the oligonucleotide/oligosaccharide binding folds DBD-A through DBD-E. Modified from image provided by Dr Marc Wold.
Official websites use .gov
A
.gov website belongs to an official
government organization in the United States.
Secure .gov websites use HTTPS
A lock (
) or https:// means you've safely
connected to the .gov website. Share sensitive
information only on official, secure websites.
Illustration of the RPA heterotrimer depicting the oligonucleotide/oligosaccharide binding folds DBD-A through DBD-E. Modified from image provided by Dr Marc Wold.