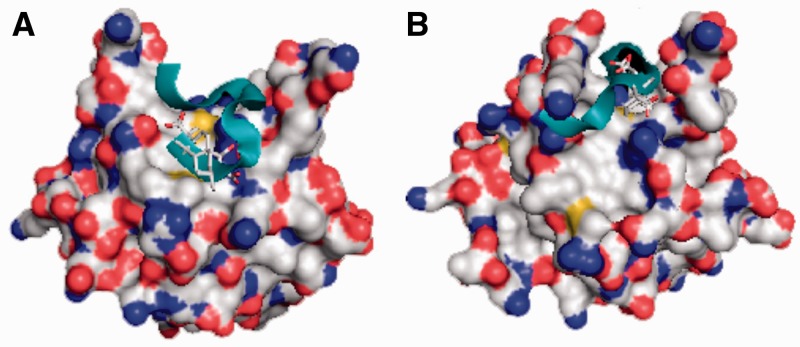
Figure 5.
Docking simulations of a crystal structure of DBD-F and conformer optimized for FPA binding. For both structures, FPA is shown in stick form, whereas the p53TAD2 sequence ‘MDDLMLSPDDI’ is represented by a ribbon structure. (A) The original crystal structure of DBD-F docked to FPA and p53TAD2 [−5.5 and −4.4 kcal/mol (24.5 µM and 204.7 µM), respectively]. (B) A DBD-F model optimized for FPA binding docked FPA and p53TAD2 [−6.6 and −5.9 kcal/mol (2.9 µM and 11.3 µM), respectively].

