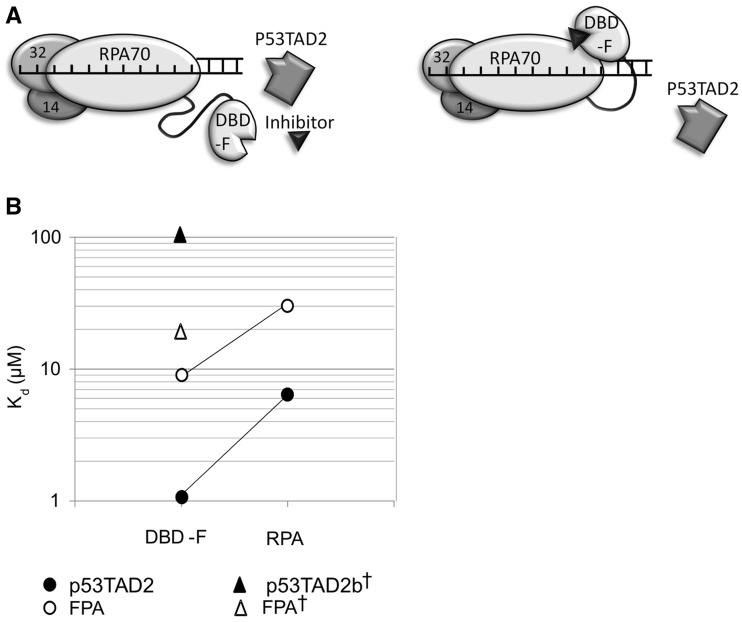
Figure 6.
(A) Comparison of Kd values for p53 peptides and FPA binding to DBD-F and RPA. Solid and hollow circles are p53TAD2 and FPA Kd values, respectively, determined in this study. Solid and hollow triangles are p53TAD2b [15 aa peptide (aa 43–57 of p53)] and FPA Kd values, respectively, as reported in previous literature and therein denoted by (†)(63). (B) Depiction of competition between p53TAD2 and an inhibitor for the DBD-F accompanied by a change in conformation.

