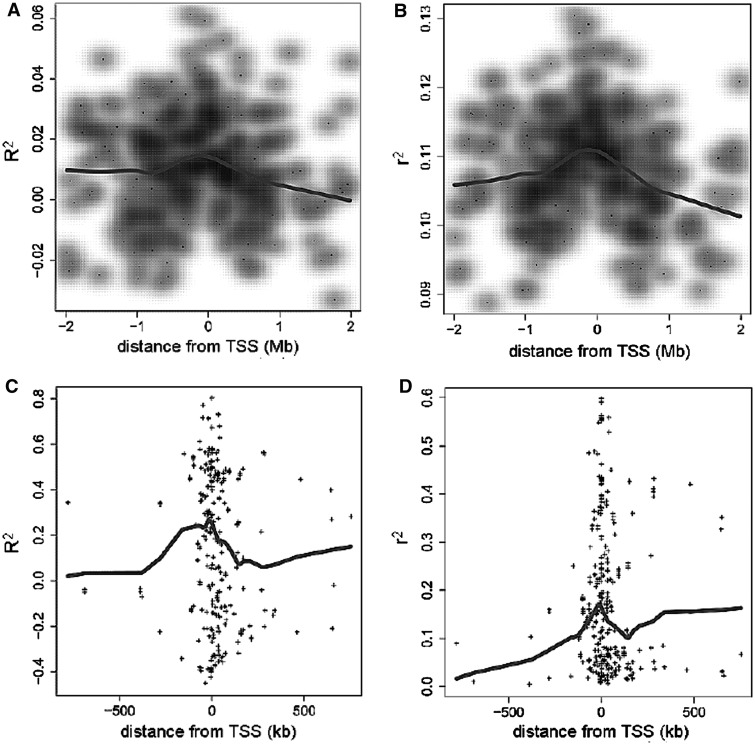
Figure 3.
(A and B)  and
and  of regression models describing co-expression between TFs and all genes relative to distance between CREs and TSS. Hazes indicate a higher density of CREs. (C and D)
  and
and  of regression models describing co-expression between TFs and target genes for only CREs with an eQTL SNP. Lines show vertical averaging of the statistics.

