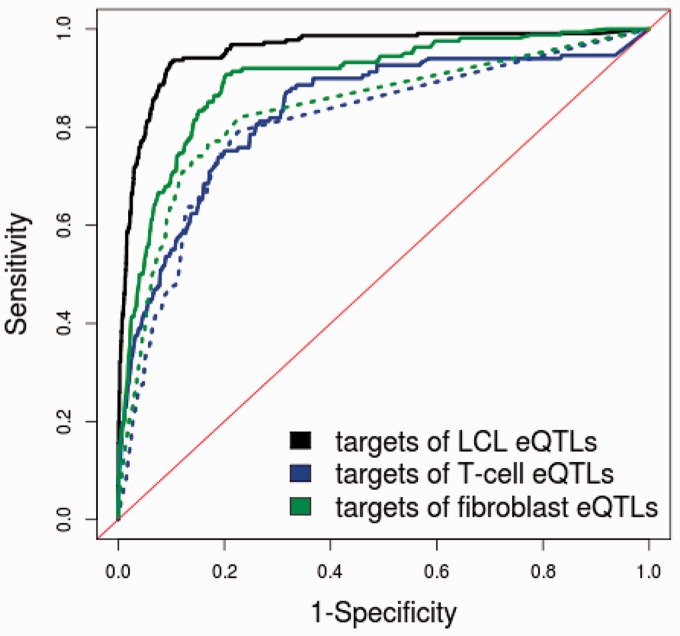
Figure 6.
Comparison of prediction performance for targets of eQTLs in different cell types. For prediction of fibroblast and T-cell targets, we also trained the classifiers on LCL eQTLs and used features generated from GM12878 ChIP-seq and FAIRE data. Because LCL data were used to train the model, it is not surprising to see that the prediction of targets for LCLs achieved a better ROC curve. The performance of predictions using all six features (solid lines) is compared with the performance of predictions using only genomic distance (dotted line).

