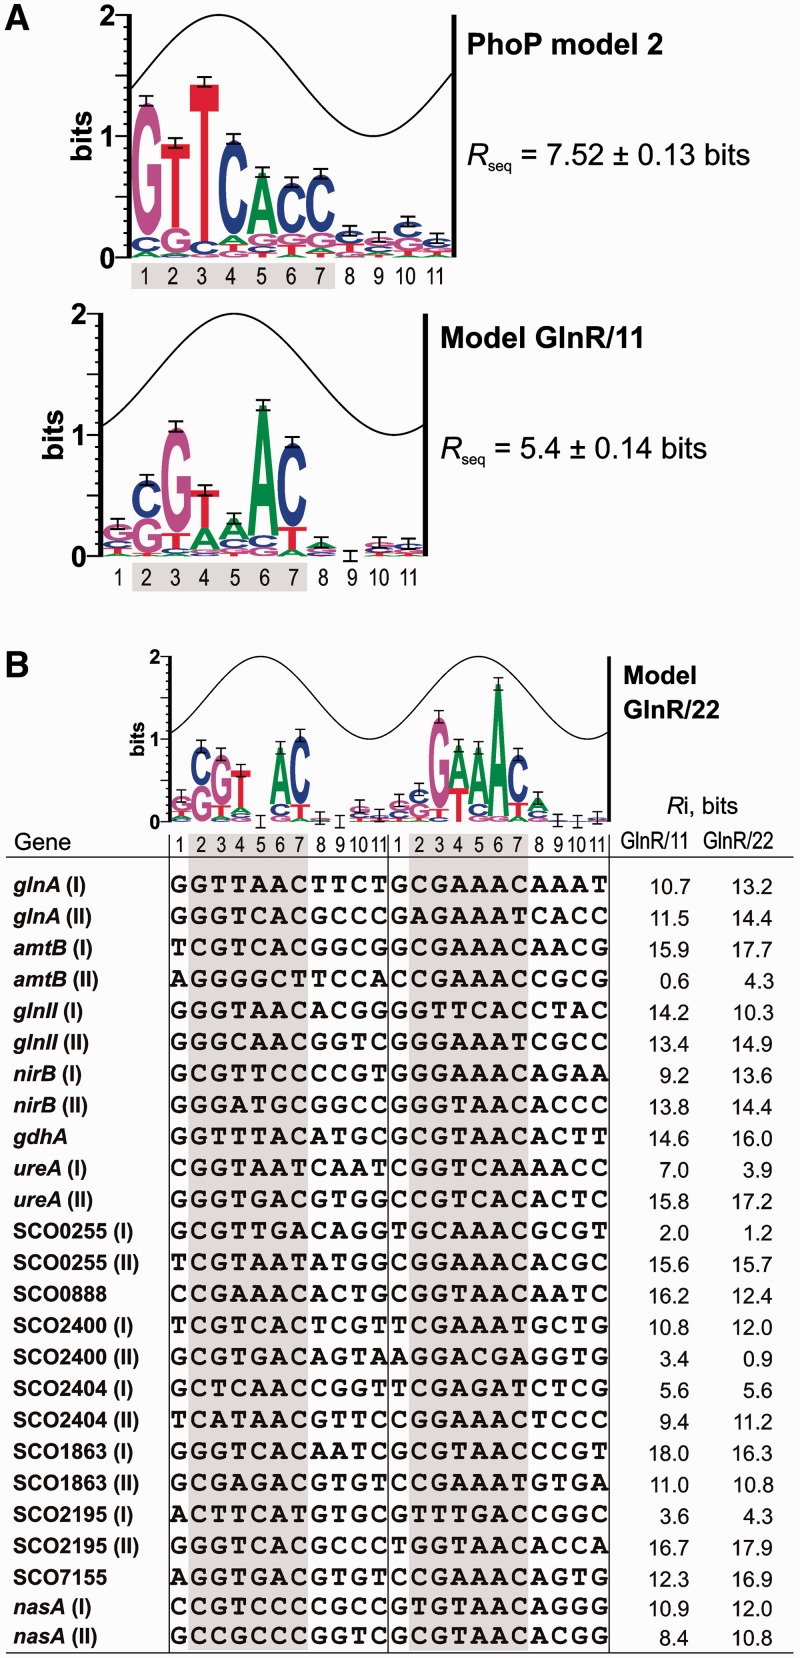
Figure 4.
(A) Sequence logos of the model GlnR/11 and of the PhoP model 2. The sine wave represents the accessibility of a face of the DNA (B-form, 11 bases of helical pitch). The height of each letter is proportional to the frequency of that base in the aligned sequences used to build the model, and the height of the letter stack is the conservation in bits at that position (33). Error bars are shown at the top of the stacks. (B) Sequence logo of the model GlnR/22 and alignment of the 25 sequences that form the GlnR boxes included in this model. When two boxes are present, they are consecutive except in nasA. In this promoter the second box, i.e. the 3rd and 4th repeats, is separated by 1 nt from the first one. The clearly conserved positions are indicated by a grey shade.

