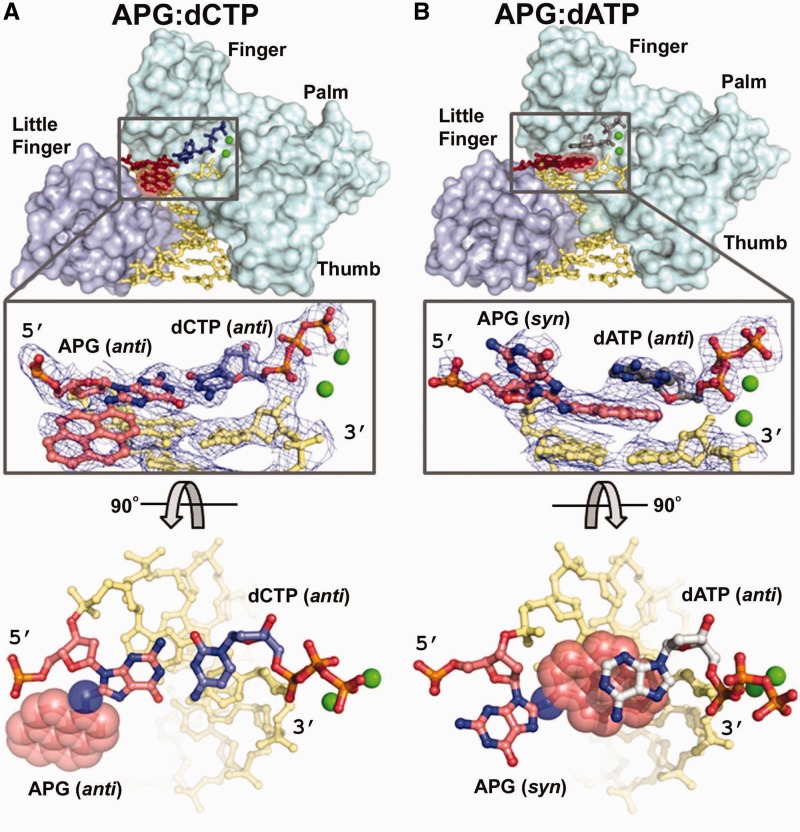
Figure 3.
The polι-APG ternary complexes with zoomed-in replicating base pairs (A) APG-dCTP and (B) APG-dATP structures. The finger, thumb and palm domains are colored cyan as the ‘core’, while the little finger domains are colored light blue. The DNA is in yellow, the APG lesion in red, dCTP in blue and dATP in grey. Active site metal ions are shown as green spheres. Zoom-in views of the active sites are shown below the structures with the 2Fo-Fc electron density map contoured at 1σ and in top views of the APG:dCTP and APG:dATP replicating base pairs. The APG lesion is in red, with sphere representation for the hydrophobic ring in the top views.

