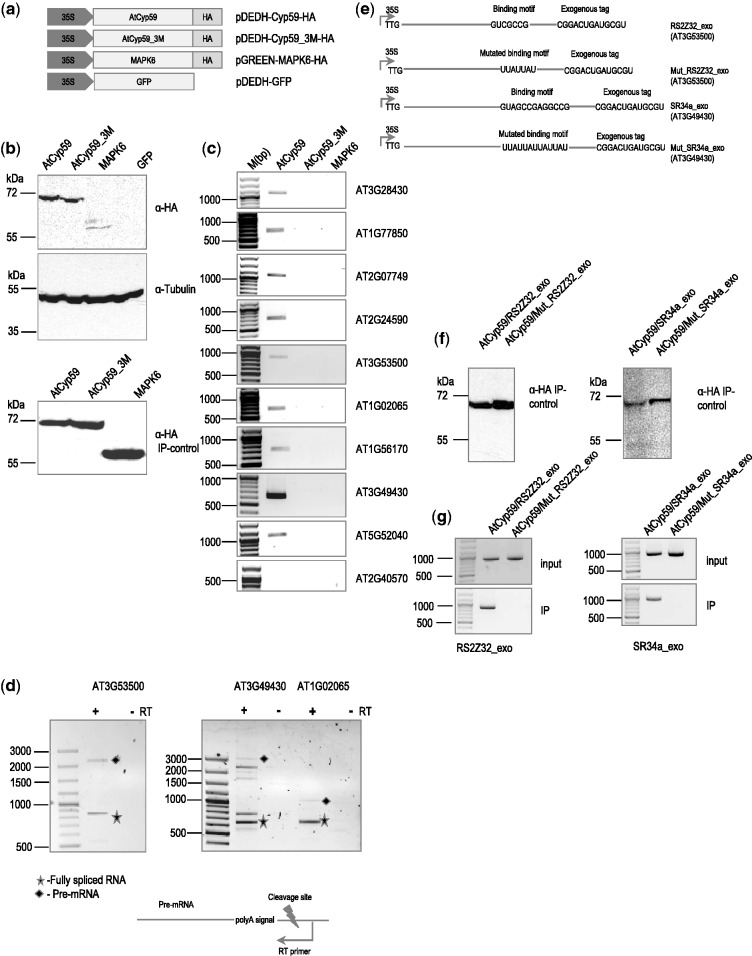
Figure 4.
Transiently expressed AtCyp59 HA-tagged proteins in the A. thaliana protoplasts bind to endogenous mRNAs in vivo. (a) Schematic representation of the AtCyp59 constructs used in the transient transformation experiments. 35S, CaMV 35S RNA promoter sequence; HA, hemagglutinine antigen; 3M; mutations in the RRM domain (the same as in Figure 3a); GFP, green fluorescence protein; MAPK6, mitogen-activated protein kinase 6. (b) Western blot analyses of cells overexpressing the depicted constructs were performed using anti-HA antibody (upper panel) or anti-tubulin antibody (middle panel). Bottom panel is a western blot analysis of an HA immunoprecipitation used for RNA analysis shown in (c). Molecular weight markers are indicated on the left side. (c) Analysis of RNAs immunoprecipitated with the indicated proteins. RT–PCR with primers to the genes indicated on the right side (33 PCR cycles; primers used are listed in the Supplementary Table S3). Molecular weight marker is shown on the left side in bp range. (d) Analysis of selected pre-mRNAs immunoprecipitated with AtCyp59. Primers for RT reaction are designed to tag a pre-mRNA after the polyA signal; primers in the PCR are the same as in (c). +RT, PCR with reverse transcriptase added; -RT, PCR without reverse transcriptase; filled diamond, pre-mRNA product; star, fully spliced mRNA product. Other bands in the AT3G4930 lane are partially spliced products. (e) Schematic representations of the RNA constructs used for double transformation experiment with AtCyp59. TTG, mutated translational start codon; line, coding sequence of the gene; exogenous tag, partial sequence of the hemagglutinine antigen. (f) Western blot analyses of immunoprecipitation experiments with cells overexpressing the depicted combinations of constructs. The molecular weight marker is displayed on the left side. (g) RT–PCR with primers to the genes indicated at the bottom (primers used are listed in the Supplementary Table S3). Molecular weight marker is shown on the left side in bp range. Upper panel is a RT–PCR from total RNA isolated from protoplasts double transformed with the depicted constructs. Lower panel is an RT–PCR of RNA isolated after IP. Bands shown are amplified using the primers to the synthetic RNA construct which were designed to differentiate from endogenously expressed RNA.

