Figure 7.
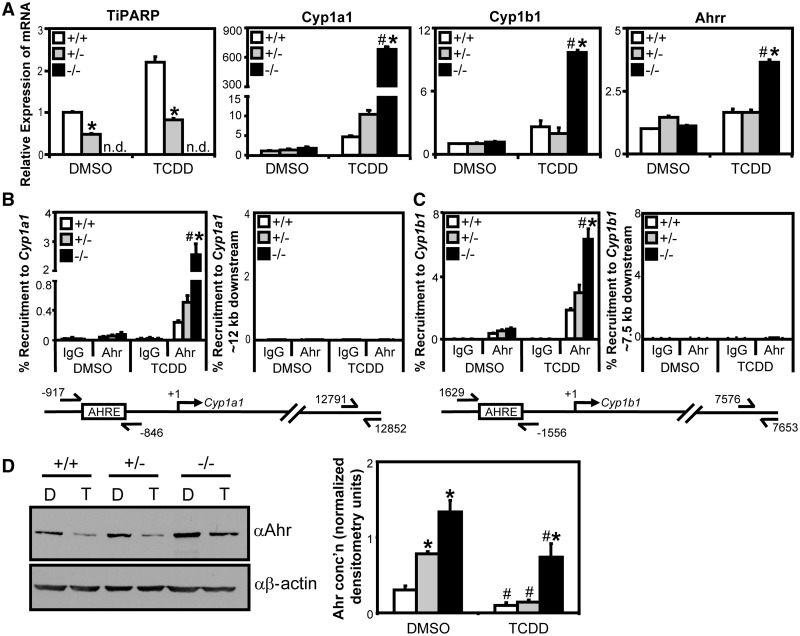
Tiparp knockout fibroblasts exhibited increased TCDD-induced Ahr transactivation. (A) wildtype (Tiparp+/+), Tiparp+/− and Tiparp−/− immortalized MEF lines were treated with 10 nM TCDD for 24 h and gene expression determined. Gene expression was normalized relative to DMSO-treated wildtype cells. Gene expression levels significantly (P < 0.05) different than treatment matched wildtype cells were denoted with an asterisk, and gene expression levels significantly (P < 0.05) different than treatment-matched Tiparp+/− (+/−) cells were denoted with a pound sign. (B and C) Tiparp−/− cells exhibit increased TCDD-induced Ahr recruitment to Cyp1a1 and Cyp1b1. (B) Ahr Recruitment to Cyp1a1 regulatory region and distal downstream control region. (C) Ahr recruitment to Cyp1b1 regulatory region and distal downstream control region. MEF lines were treated with 10 nM TCDD for 45 min and harvested for ChIP assays as described in ‘Materials and Methods’ section. Percent recruitment significantly greater (P < 0.05) than treatment-matched wildtype cells was denoted with an asterisk, and percent recruitment significantly greater (P < 0.05) than treatment-matched Tiparp+/− (+/−) cells was denoted with a pound sign. (D) Tiparp−/− cells have reduced TCDD-induced Ahr degradation. MEF lines following were treated with TCDD (T) or DMSO (D) for 24 h and Ahr protein expression was determined by western blot analysis. Left panel: representative western blot from three independent experiments. Right panel: quantification of Ahr protein levels, densitometry was performed using ImageJ analysis software (NIH). Asterisks denoted Ahr protein levels significantly (P < 0.05, two-tailed Student’s t-test) greater than treatment-matched wildtype cells. Pound sign denoted Ahr protein levels significantly (P < 0.05, two-tailed Student’s t-test) less than genotype-matched DMSO-treated cells.

