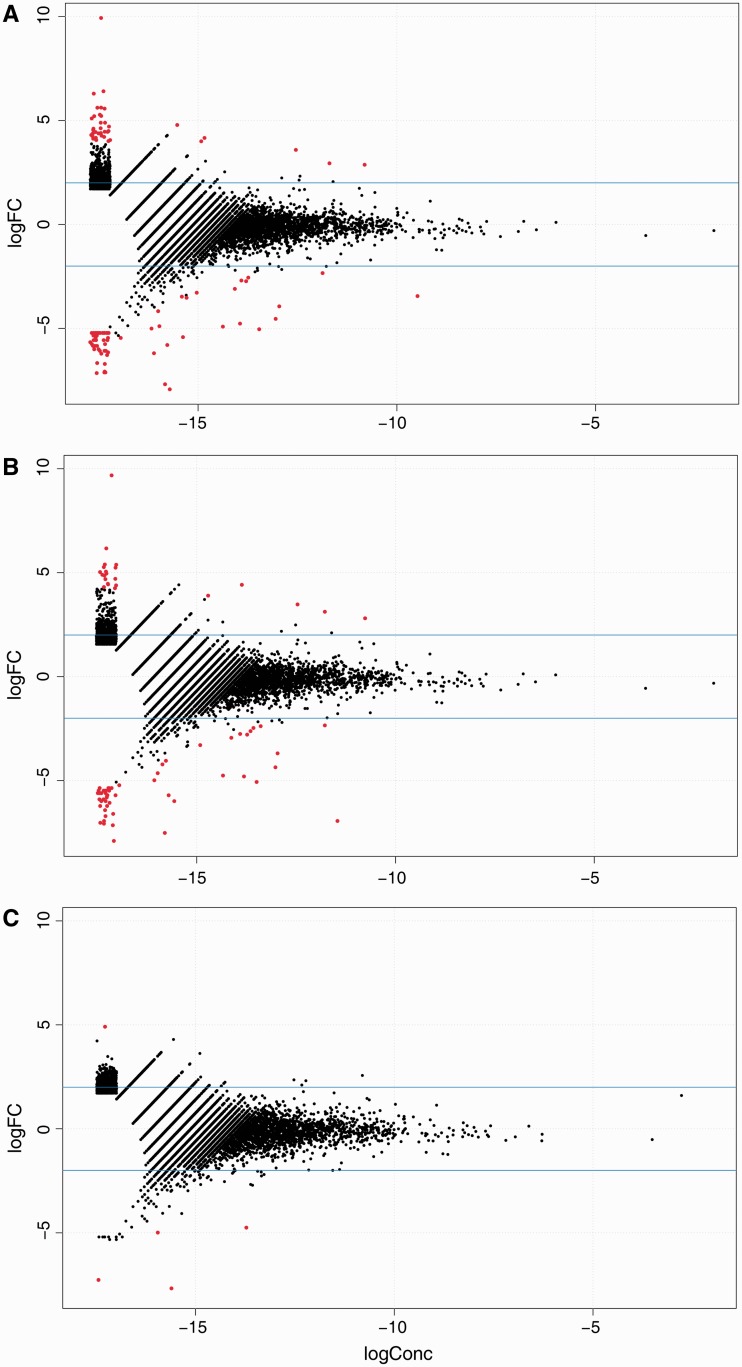
Figure 3.
Differential expression analyses were carried out between technical replicates made from different barcode sequences using edgeR. The scatter plots show the log-fold change (y-axis) against the log concentration (x-axis) for tag clusters present among the 14P technical replicates. In red are tag clusters that were detected as differentially expressed at an adjusted P-value ≤ 0.01. Three separate analyses were carried out: test for differential expression (A) before strand invasion artifacts were filtered out, (B) when random reads were removed and (C) after strand invasion artifacts were filtered out. By removing artifacts, fewer tag clusters were detected as differentially expressed compared with no filtering and removing random reads.

