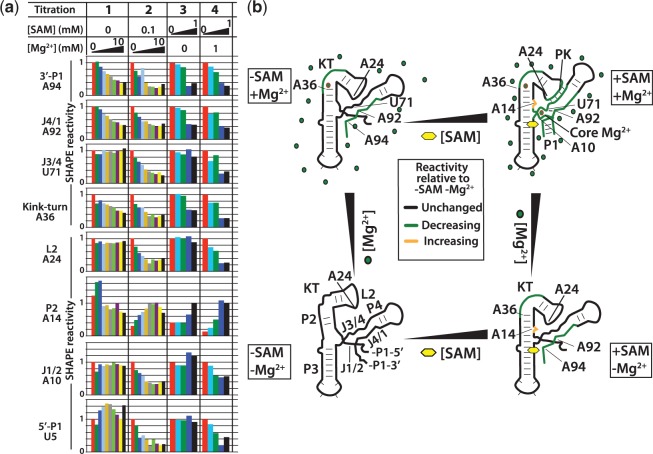
Figure 3.
SAM-Mg2+ landscape for aptamer collapse: quantified SHAPE probing results following the aptamer collapse process for SAM and Mg2+ titrations. (a) Peak integration results for four representative titration experiments at the eight regions analysed. Peaks are integrated and normalized to the reactivity at position U84. The reactivity at the lowest titrated concentration is set to 1. The exception is A14 in helix P2 where the collapsed aptamer conformation produces increased reactivity consistent with the observed conformation in the X-ray structure. Here, the reactivity at 2 mM Mg2+ and 1 mM SAM for the Mg2+ and SAM titrations, respectively, is set to 1. For the Mg2+ titrations, the concentrations are 0, 100 µM, 200 µM, 300 µM, 400 µM, 800 µM, 1 mM, 2 mM, 4 mM and 10 mM. SAM titration concentrations are 0, 1 µM, 10 µM, 100 µM and 1 mM. (b) Schematic representation of the collapse process observed in (a). Green, regions that decrease in mobility with increasing SAM or Mg2+ relative to no SAM and no Mg2+. Black, regions that are unchanged in mobility with increasing SAM or Mg2+ relative to no SAM and no Mg2+. Yellow, regions that increase in mobility with increasing SAM or Mg2+ relative to no SAM and no Mg2+. The final collapsed structure is only observed with both SAM and Mg2+ interactions.

