
Fig. 8.
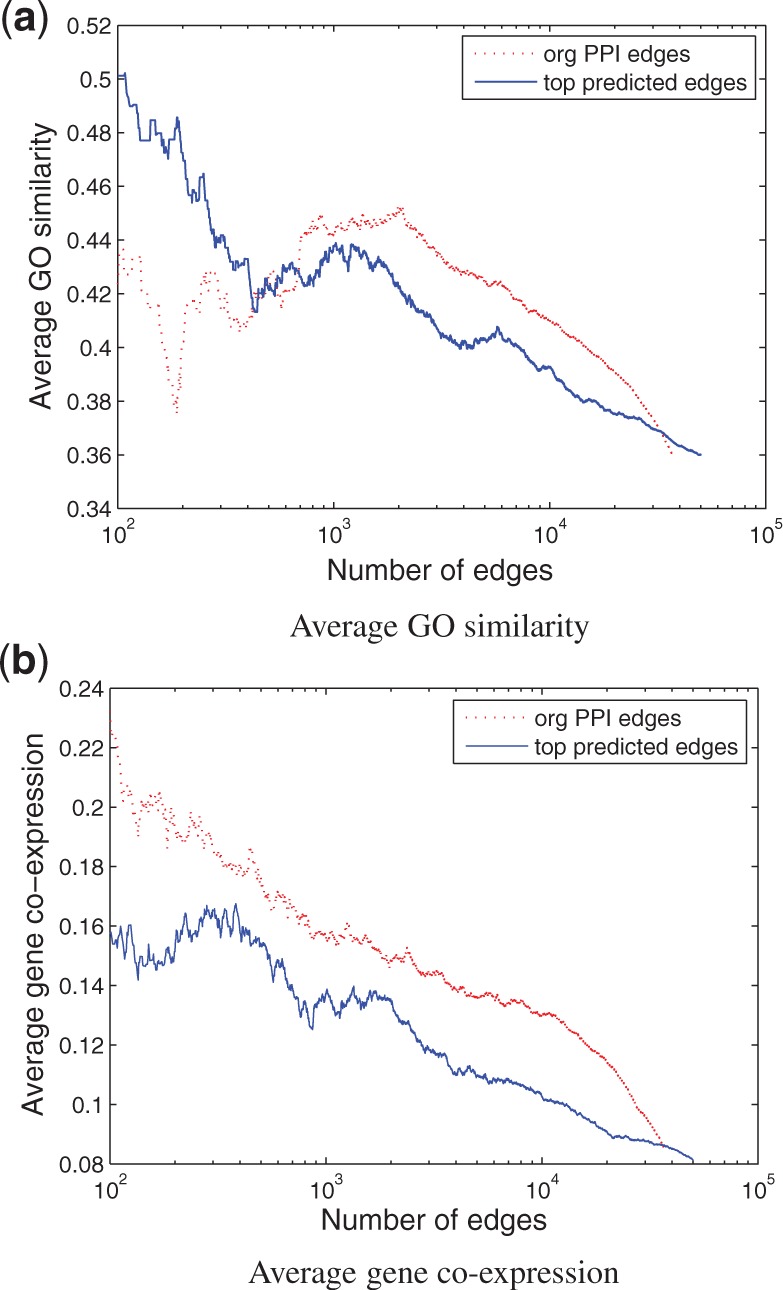
Quality of top predicted human PPIs as compared with that of the original PPIs. Predicted/original PPIs are ranked by their topological similarity scores. All edges above a particular rank are then used to calculate the average GO similarity score (a) or average gene co-expression (b)