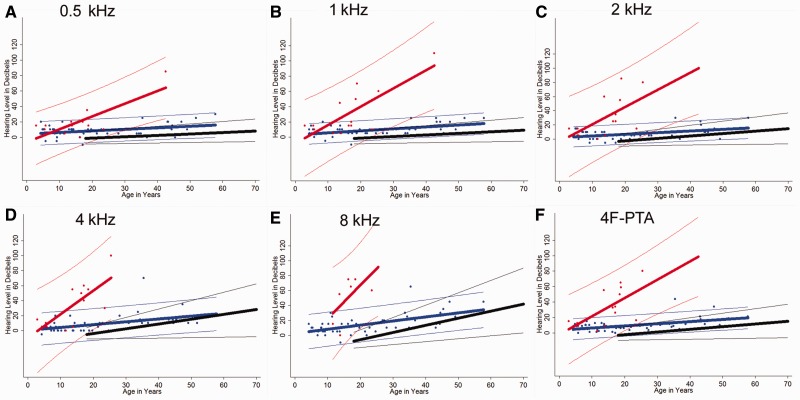
Figure 8.
Regression curve analysis by Chow test. (A–F) We compared combined gender ISO 7029 normative data (black), patients with xeroderma pigmentosum without neurological involvement (blue) and patients with xeroderma pigmentosum-type neurodegeneration (red) for 0.5, 1, 2, 4 and 8 kHz and the 4F-PTA. Regression curves for the patients with xeroderma pigmentosum are derived from the worse hearing ear at the earliest complete audiogram for each patient. The thicker line in the middle of each group of coloured data points represents a linear regression line corresponding to decibel level as predicted by age for that particular group. The thinner outer lines of each group mark the boundaries within which you would expect to find 95% of the sample’s values for a given age based on calculated prediction intervals. For the normal group, the recorded intervals represent those within which 95% of the population lies. P-values are <0.001 for all frequencies (including 4F-PTA) when comparing the combination of intercepts and slope for regression curves between xeroderma pigmentosum-type neurological degeneration, patients with xeroderma pigmentosum without neurological involvement and ISO normal populations, with the exception of ISO normal versus xeroderma pigmentosum no neurological involvement at 4 kHz (P = 0.006). All values are significant at Bonferroni-adjusted value of P < 0.002.

