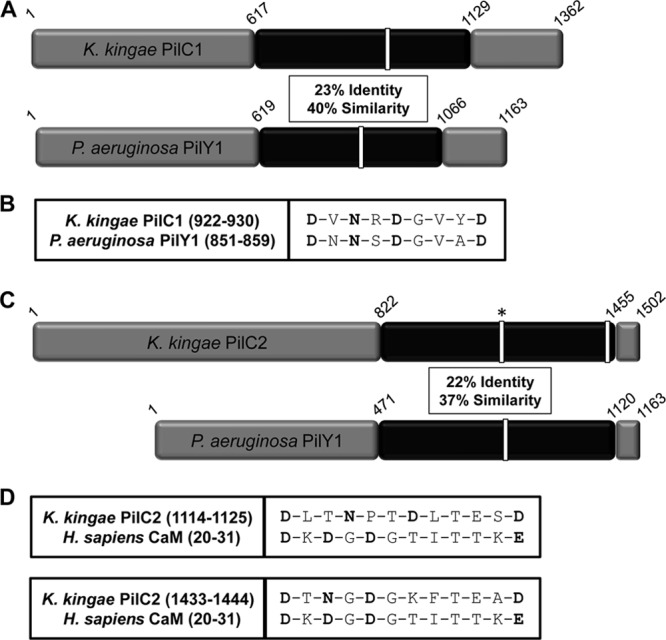
Fig 1.

(A) Sequence comparison of K. kingae PilC1 with P. aeruginosa PilY1 highlighting the C-terminal region with the greatest amount of homology (in black). Sequence identity and similarity values are given for the region in black. White bars represent putative and confirmed calcium-binding domains in K. kingae and P. aeruginosa, respectively. (B) Alignment of the K. kingae PilC1 putative Ca-binding site with the calcium-chelating residues of P. aeruginosa PilY1, with the potential calcium-chelating residues of PilC1 shown in bold. (C) Sequence comparison of K. kingae PilC2 with P. aeruginosa PilY1 highlighting the C-terminal region with the greatest amount of homology (in black). Sequence identity and similarity values are given for the region in black. White bars represent putative and confirmed calcium-binding domains in K. kingae and P. aeruginosa, respectively. The white bar with an asterisk in the K. kingae PilC2 sequence represents a site homologous to a CaM calcium-binding site that does not bind calcium. (D) Alignment of the K. kingae PilC2 putative Ca-binding sites, with the calcium-chelating residues of human calmodulin and the potential calcium-chelating residues of PilC2 shown in bold.
