Figure 2. .

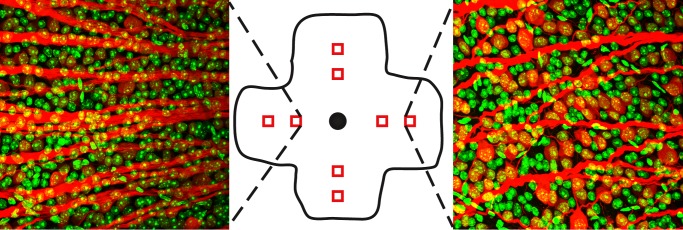
Inner retina staining. Neurobiotin-positive (red) and TO-PRO3–positive (green) cells were counted from 8 regions per retina (middle, red squares). Left: typical staining pattern from the midretina. Right: typical staining pattern from the peripheral retina.
